Estimated Value: $240,000 - $288,000
3
Beds
2
Baths
1,300
Sq Ft
$208/Sq Ft
Est. Value
About This Home
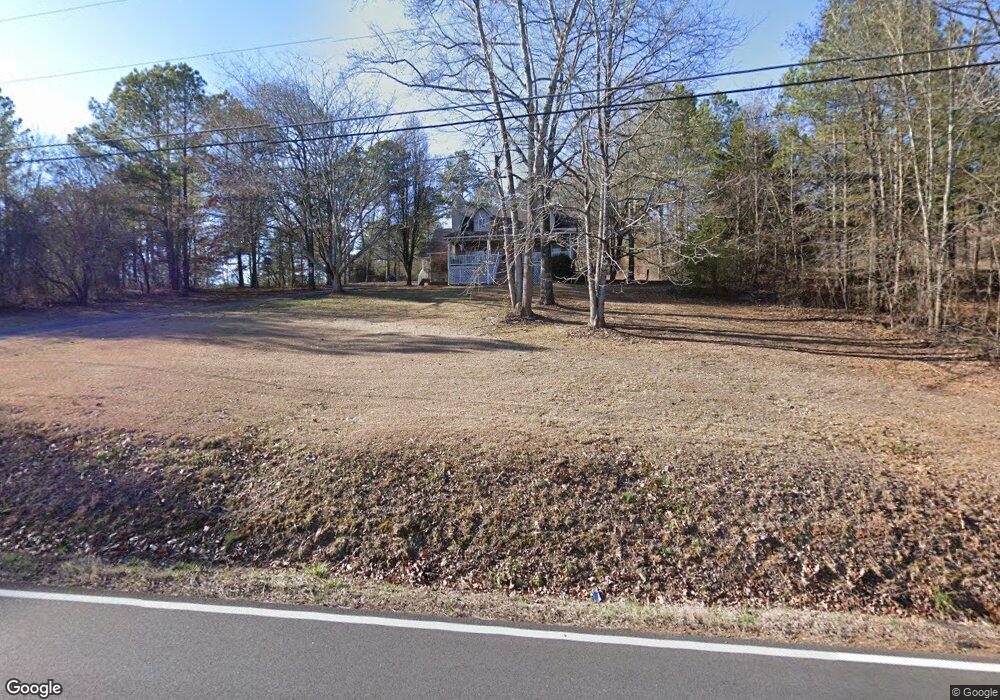
This home is located at 3287 Old Dalton Rd NE, Rome, GA 30165 and is currently estimated at $269,863, approximately $207 per square foot. 3287 Old Dalton Rd NE is a home located in Floyd County with nearby schools including Armuchee Middle School and Armuchee High School.
Ownership History
Date
Name
Owned For
Owner Type
Purchase Details
Closed on
May 31, 2006
Sold by
Not Provided
Bought by
Hibberts Michael A and Hibberts Kimberly B
Current Estimated Value
Home Financials for this Owner
Home Financials are based on the most recent Mortgage that was taken out on this home.
Original Mortgage
$114,695
Outstanding Balance
$67,205
Interest Rate
6.51%
Mortgage Type
FHA
Estimated Equity
$202,658
Purchase Details
Closed on
Nov 1, 2005
Sold by
Chase Home Finance Llc
Bought by
Sec Of Housing & Urban
Purchase Details
Closed on
Nov 13, 2003
Sold by
Moore Kenneth and Melinda Moore
Bought by
Connell Joey R and Connell Ruth C
Purchase Details
Closed on
Jul 13, 1998
Sold by
Hansard Larry
Bought by
Moore Kenneth and Melinda Moore
Purchase Details
Closed on
Dec 15, 1993
Sold by
Hansard Larry and Ernard Brown
Bought by
Hansard Larry
Purchase Details
Closed on
Dec 21, 1991
Bought by
Hansard Larry and Ernard Brown
Create a Home Valuation Report for This Property
The Home Valuation Report is an in-depth analysis detailing your home's value as well as a comparison with similar homes in the area
Home Values in the Area
Average Home Value in this Area
Purchase History
| Date | Buyer | Sale Price | Title Company |
|---|---|---|---|
| Hibberts Michael A | -- | -- | |
| Sec Of Housing & Urban | $142,537 | -- | |
| Chase Home Finance Llc | $142,537 | -- | |
| Connell Joey R | $136,800 | -- | |
| Moore Kenneth | $13,000 | -- | |
| Hansard Larry | $19,000 | -- | |
| Hansard Larry | $7,900 | -- |
Source: Public Records
Mortgage History
| Date | Status | Borrower | Loan Amount |
|---|---|---|---|
| Open | Hibberts Michael A | $114,695 |
Source: Public Records
Tax History Compared to Growth
Tax History
| Year | Tax Paid | Tax Assessment Tax Assessment Total Assessment is a certain percentage of the fair market value that is determined by local assessors to be the total taxable value of land and additions on the property. | Land | Improvement |
|---|---|---|---|---|
| 2024 | $2,315 | $106,821 | $15,101 | $91,720 |
| 2023 | $2,331 | $103,119 | $13,728 | $89,391 |
| 2022 | $2,037 | $85,028 | $11,326 | $73,702 |
| 2021 | $1,788 | $69,529 | $10,308 | $59,221 |
| 2020 | $1,729 | $65,601 | $8,964 | $56,637 |
| 2019 | $1,585 | $58,758 | $8,964 | $49,794 |
| 2018 | $1,534 | $55,802 | $8,538 | $47,264 |
| 2017 | $1,502 | $53,868 | $7,905 | $45,963 |
| 2016 | $1,368 | $47,991 | $7,880 | $40,111 |
| 2015 | -- | $47,991 | $7,880 | $40,111 |
| 2014 | -- | $47,991 | $7,880 | $40,111 |
Source: Public Records
Map
Nearby Homes
- 0 Marlene Dr NE Unit 10656253
- 0 Marlene Dr NE Unit 7690328
- 282 Turner Rd NE
- 201 Kellett Rd NE
- 0 Turkey Mountain Rd NE Unit 10631876
- 0 Turkey Mountain Rd NE Unit 7669730
- 334 Armuchee Trail NE
- 405 Hiram Rd NE
- 1291 Bells Ferry Rd NE
- 1035 Turkey Mountain Rd NE
- 311 Herring Rd NE
- 4569 Old Dalton Rd NE
- 1863 New Rosedale Rd NE
- 1465 Turner Rd NE
- 1194 New Rosedale Rd NE
- 1024 New Rosedale Rd NE
- 1085 New Rosedale Rd NE
- 0 Highway 140 Unit 20164671
- 26 Hatfield Rd NE
- 0 Hatfield Rd NE Unit 7533301
- 3309 Old Dalton Rd NE
- 3265 Old Dalton Rd NE
- 3290 Old Dalton Rd NE
- 3290 Old Dalton Rd NE
- 3349 Old Dalton Rd NE
- 3273 Old Dalton Rd NE
- 3273 Old Dalton Rd NE
- 3358 Old Dalton Rd NE
- 1421 Turkey Mountain Rd NE
- 3192 Old Dalton Rd NE
- 1419 Turkey Mountain Rd NE
- 1595 Turkey Mountain Rd NE
- 1506 Turkey Mountain Rd NE
- 1393 Turkey Mountain Rd NE
- 3388 Old Dalton Rd NE
- 1611 Turkey Mountain Rd NE
- 3415 Old Dalton Rd NE
- 1404 Turkey Mountain Rd NE
- 3179 Old Dalton Rd NE
- 3399 Old Dalton Rd NE