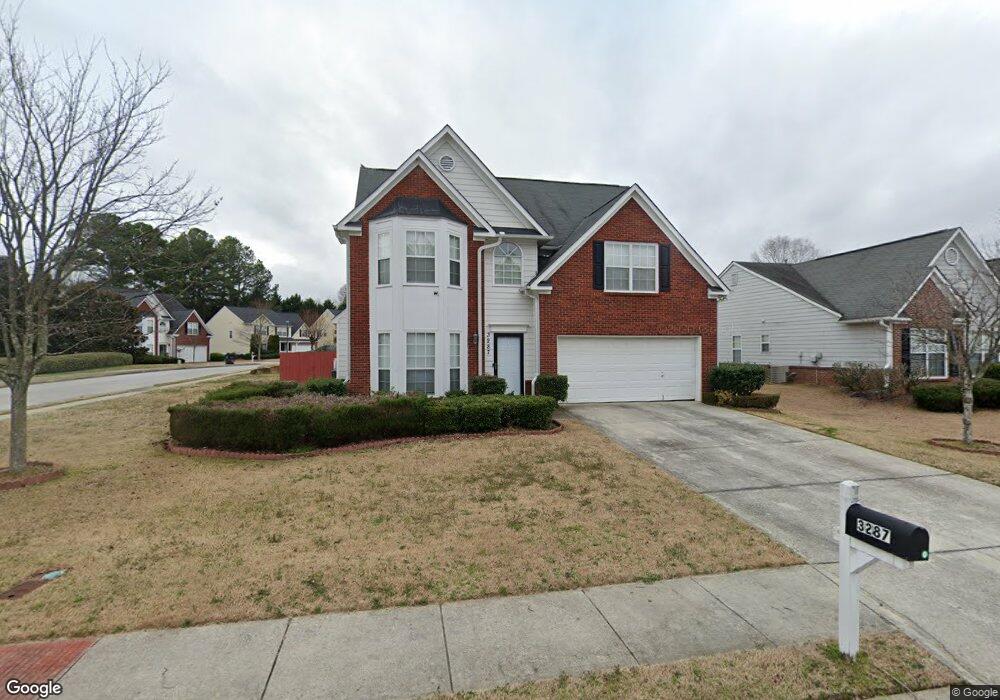
3287 Shady Valley Ln SW Unit 39 Loganville, GA 30052
Estimated Value: $346,000 - $351,000
4
Beds
3
Baths
2,204
Sq Ft
$158/Sq Ft
Est. Value
About This Home
This home is located at 3287 Shady Valley Ln SW Unit 39, Loganville, GA 30052 and is currently estimated at $348,983, approximately $158 per square foot. 3287 Shady Valley Ln SW Unit 39 is a home located in Gwinnett County with nearby schools including Trip Elementary School, Bay Creek Middle School, and Grayson High School.
Ownership History
Date
Name
Owned For
Owner Type
Purchase Details
Closed on
Apr 26, 2021
Sold by
Smalls Sumpter Antonia C
Bought by
Footman Ketreena Roshawn
Current Estimated Value
Home Financials for this Owner
Home Financials are based on the most recent Mortgage that was taken out on this home.
Original Mortgage
$274,928
Outstanding Balance
$248,091
Interest Rate
3.1%
Mortgage Type
FHA
Estimated Equity
$100,892
Purchase Details
Closed on
Jun 25, 2014
Sold by
Mcdermott Debbie A
Bought by
Sumpter Antonia C
Home Financials for this Owner
Home Financials are based on the most recent Mortgage that was taken out on this home.
Original Mortgage
$144,337
Interest Rate
4.25%
Mortgage Type
FHA
Purchase Details
Closed on
Feb 21, 2002
Sold by
Richardson Housing Grp Inc
Bought by
Mcdermott Debbie A
Home Financials for this Owner
Home Financials are based on the most recent Mortgage that was taken out on this home.
Original Mortgage
$129,050
Interest Rate
6.95%
Mortgage Type
New Conventional
Create a Home Valuation Report for This Property
The Home Valuation Report is an in-depth analysis detailing your home's value as well as a comparison with similar homes in the area
Home Values in the Area
Average Home Value in this Area
Purchase History
| Date | Buyer | Sale Price | Title Company |
|---|---|---|---|
| Footman Ketreena Roshawn | $285,000 | -- | |
| Footman Ketreena Roshawn | -- | -- | |
| Sumpter Antonia C | $147,000 | -- | |
| Mcdermott Debbie A | $143,400 | -- |
Source: Public Records
Mortgage History
| Date | Status | Borrower | Loan Amount |
|---|---|---|---|
| Open | Footman Ketreena Roshawn | $274,928 | |
| Closed | Footman Ketreena Roshawn | $274,928 | |
| Previous Owner | Sumpter Antonia C | $144,337 | |
| Previous Owner | Mcdermott Debbie A | $129,050 |
Source: Public Records
Tax History Compared to Growth
Tax History
| Year | Tax Paid | Tax Assessment Tax Assessment Total Assessment is a certain percentage of the fair market value that is determined by local assessors to be the total taxable value of land and additions on the property. | Land | Improvement |
|---|---|---|---|---|
| 2024 | $4,191 | $139,720 | $26,120 | $113,600 |
| 2023 | $4,191 | $142,120 | $29,600 | $112,520 |
| 2022 | $3,622 | $114,000 | $22,000 | $92,000 |
| 2021 | $2,621 | $77,920 | $16,800 | $61,120 |
| 2020 | $2,638 | $77,920 | $16,800 | $61,120 |
| 2019 | $2,413 | $70,960 | $14,000 | $56,960 |
| 2018 | $2,412 | $70,960 | $14,000 | $56,960 |
| 2016 | $2,163 | $58,520 | $10,400 | $48,120 |
| 2015 | $2,184 | $58,520 | $10,400 | $48,120 |
| 2014 | -- | $58,520 | $10,400 | $48,120 |
Source: Public Records
Map
Nearby Homes
- Luca Plan at Langley Overlook
- 3205 Wellbrook Dr
- Stanford Plan at Lake Carlton
- 411 Ryland Ave
- 745 Midway Rd
- 823 Langley View Ct
- 3227 Hollowstone Dr
- 0 Highway 78 Unit 10376768
- 0 Highway 78 Unit 7454844
- 0 Highway 78 Unit 10133175
- 3523 Stonebranch Ln
- 3415 Lake Carlton Rd
- 826 Leraes Way
- 828 Leraes Way
- 834 Leraes Way
- 836 Leraes Way
- 866 Leraes Way
- 862 Leraes Way
- 860 Leraes Way
- 3287 Shady Valley Ln Unit 39
- 3277 Shady Valley Ln
- 3290 Wrenwood Ct
- 3305 Wrenwood Ct
- 3267 Shady Valley Ln
- 3286 Shady Valley Ln
- 3270 Wrenwood Ct Unit 1
- 3276 Shady Valley Ln Unit 2
- 3315 Wrenwood Ct
- 3250 Wrenwood Ct
- 3325 Wrenwood Ct
- 3266 Shady Valley Ln
- 0 Shady Valley Ln SW Unit 7201819
- 0 Shady Valley Ln SW Unit 7125098
- 0 Shady Valley Ln SW Unit 3213911
- 0 Shady Valley Ln SW Unit 7421248
- 0 Shady Valley Ln SW Unit 7076536
- 0 Shady Valley Ln SW Unit 8854414
- 0 Shady Valley Ln SW Unit 8440794
- 0 Shady Valley Ln SW Unit 7045730