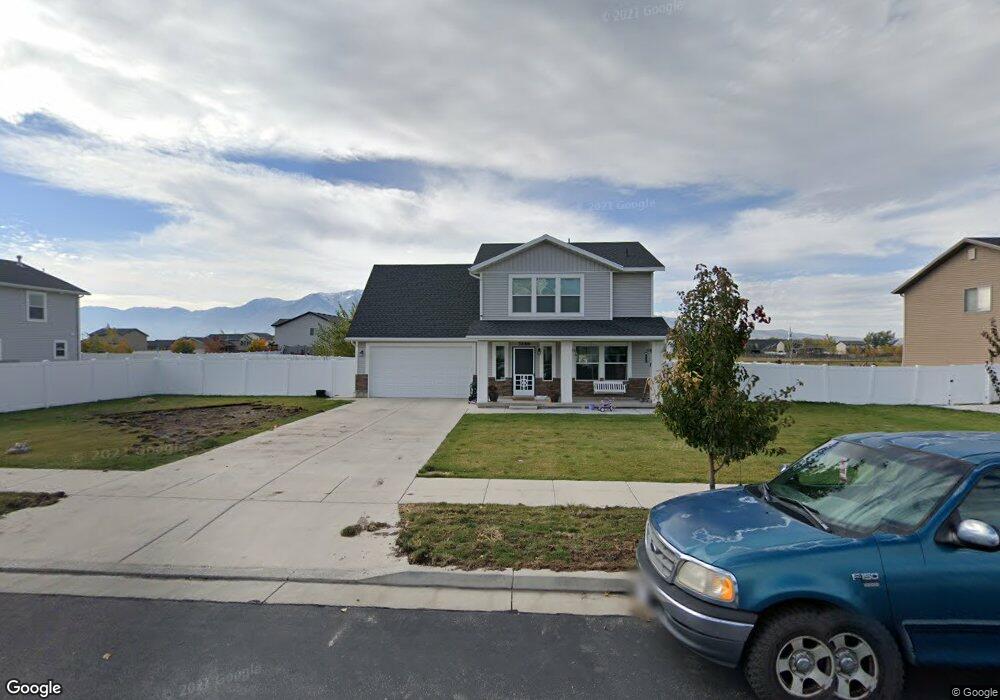
3289 S 1380 W Nibley, UT 84321
Estimated Value: $462,329 - $484,000
4
Beds
3
Baths
1,733
Sq Ft
$273/Sq Ft
Est. Value
About This Home
This home is located at 3289 S 1380 W, Nibley, UT 84321 and is currently estimated at $473,082, approximately $272 per square foot. 3289 S 1380 W is a home located in Cache County with nearby schools including Heritage School, South Cache Middle School, and Spring Creek Middle School.
Ownership History
Date
Name
Owned For
Owner Type
Purchase Details
Closed on
Dec 26, 2019
Sold by
Mills Brycen H and Mills Amy
Bought by
Alarcon Federico M and Alarcon Cassie J
Current Estimated Value
Home Financials for this Owner
Home Financials are based on the most recent Mortgage that was taken out on this home.
Original Mortgage
$277,777
Outstanding Balance
$244,857
Interest Rate
3.7%
Mortgage Type
New Conventional
Estimated Equity
$228,225
Purchase Details
Closed on
Oct 3, 2014
Sold by
Mills Brycen H
Bought by
Mills Brycen H and Mills Amy
Home Financials for this Owner
Home Financials are based on the most recent Mortgage that was taken out on this home.
Original Mortgage
$184,336
Interest Rate
4.07%
Mortgage Type
New Conventional
Create a Home Valuation Report for This Property
The Home Valuation Report is an in-depth analysis detailing your home's value as well as a comparison with similar homes in the area
Home Values in the Area
Average Home Value in this Area
Purchase History
| Date | Buyer | Sale Price | Title Company |
|---|---|---|---|
| Alarcon Federico M | -- | American Secure Title Logan | |
| Mills Brycen H | -- | Northern Title Company | |
| Mills Brycen H | -- | Northern Title Company |
Source: Public Records
Mortgage History
| Date | Status | Borrower | Loan Amount |
|---|---|---|---|
| Open | Alarcon Federico M | $277,777 | |
| Previous Owner | Mills Brycen H | $184,336 |
Source: Public Records
Tax History Compared to Growth
Tax History
| Year | Tax Paid | Tax Assessment Tax Assessment Total Assessment is a certain percentage of the fair market value that is determined by local assessors to be the total taxable value of land and additions on the property. | Land | Improvement |
|---|---|---|---|---|
| 2025 | $1,853 | $245,570 | $0 | $0 |
| 2024 | $1,963 | $244,335 | $0 | $0 |
| 2023 | $2,060 | $240,020 | $0 | $0 |
| 2022 | $2,144 | $240,020 | $0 | $0 |
| 2021 | $1,672 | $290,719 | $60,000 | $230,719 |
| 2020 | $1,575 | $260,626 | $60,000 | $200,626 |
| 2019 | $1,651 | $260,625 | $60,000 | $200,625 |
| 2018 | $1,423 | $219,130 | $40,000 | $179,130 |
| 2017 | $1,420 | $115,830 | $0 | $0 |
| 2016 | $1,436 | $100,265 | $0 | $0 |
| 2015 | $1,235 | $100,265 | $0 | $0 |
| 2014 | $482 | $40,000 | $0 | $0 |
Source: Public Records
Map
Nearby Homes