32893 Reeses Landing Rd Cordova, MD 21625
Estimated Value: $486,000 - $1,150,562
--
Bed
2
Baths
1,956
Sq Ft
$406/Sq Ft
Est. Value
About This Home
This home is located at 32893 Reeses Landing Rd, Cordova, MD 21625 and is currently estimated at $794,521, approximately $406 per square foot. 32893 Reeses Landing Rd is a home located in Talbot County with nearby schools including Chapel District Elementary School, Easton Middle School, and Easton High School.
Ownership History
Date
Name
Owned For
Owner Type
Purchase Details
Closed on
Jun 22, 2021
Sold by
Williams John F
Bought by
Williams John F and Williams Kimbery Dawn
Current Estimated Value
Purchase Details
Closed on
Feb 4, 2020
Sold by
Kolakowski Joni and Cook Leah F
Bought by
Cook Leah F and Williams John F
Purchase Details
Closed on
Jun 26, 2018
Sold by
Cook Leah F and The Estate Of Dorothy F Willia
Bought by
Koloakowski Joni L and Cook Leah F
Purchase Details
Closed on
Apr 11, 2018
Sold by
Kolaewsko Joni L
Bought by
Kolakowski Joni L and Cook Leah F
Purchase Details
Closed on
Aug 12, 2014
Sold by
Williams Dorothy E and Estate Of John F Williams Jr
Bought by
Williams Dorothy F and Credit Shelter Trust
Purchase Details
Closed on
Oct 3, 1997
Sold by
Williams John F
Bought by
Williams John F and Williams Dorothy F
Create a Home Valuation Report for This Property
The Home Valuation Report is an in-depth analysis detailing your home's value as well as a comparison with similar homes in the area
Home Values in the Area
Average Home Value in this Area
Purchase History
| Date | Buyer | Sale Price | Title Company |
|---|---|---|---|
| Williams John F | -- | None Available | |
| Williams John F | -- | None Available | |
| Jw Monarch Llc | -- | None Available | |
| Cook Leah F | -- | None Available | |
| Cook Leah F | -- | None Available | |
| Koloakowski Joni L | -- | None Available | |
| Kolakowski Joni L | -- | Eastern Shore Title Co | |
| Williams Dorothy F | -- | None Available | |
| Williams John F | -- | -- |
Source: Public Records
Tax History Compared to Growth
Tax History
| Year | Tax Paid | Tax Assessment Tax Assessment Total Assessment is a certain percentage of the fair market value that is determined by local assessors to be the total taxable value of land and additions on the property. | Land | Improvement |
|---|---|---|---|---|
| 2025 | $4,681 | $555,167 | $0 | $0 |
| 2024 | $4,681 | $516,233 | $0 | $0 |
| 2023 | $4,107 | $477,300 | $107,600 | $369,700 |
| 2022 | $3,755 | $469,433 | $0 | $0 |
| 2021 | $3,864 | $499,267 | $0 | $0 |
| 2020 | $3,742 | $491,400 | $145,300 | $346,100 |
| 2019 | $3,710 | $491,400 | $145,300 | $346,100 |
| 2018 | $3,559 | $491,400 | $145,300 | $346,100 |
| 2017 | $3,180 | $513,400 | $0 | $0 |
| 2016 | $3,104 | $513,400 | $0 | $0 |
| 2015 | $3,352 | $513,400 | $0 | $0 |
| 2014 | $3,352 | $545,800 | $0 | $0 |
Source: Public Records
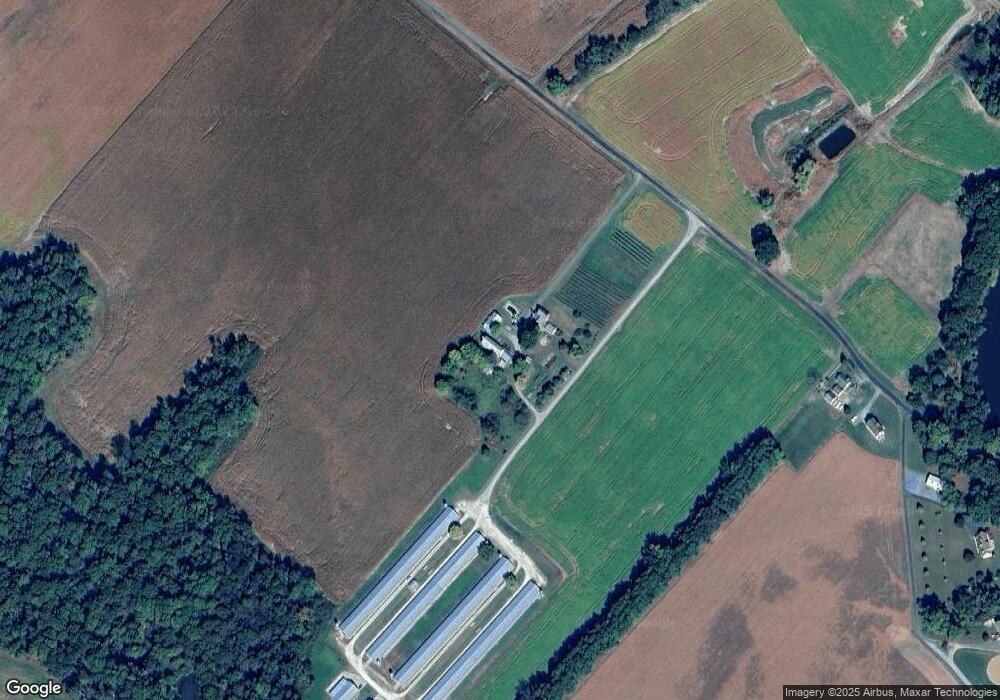
Map
Nearby Homes
- 33293 Matthewstown Rd
- 8259 Haven St
- 8578 Tuckahoe Rd
- 0 Laurel Ln
- 23296 Wilder Way
- 7929 Laurel Ln
- 0 Quail Ct Unit MDCM2006644
- 31570 Miller Rd
- 10640 Kittys Corner Rd
- LOT #6 High Banks Dr
- 0 High Banks Dr
- 9059 High Banks Dr
- 6561 Bell Creek Rd
- 11482 Kittys Corner Rd
- 0 Asbury Dr
- 24276 Asbury Dr
- 31127 Willis St
- 24324 Asbury Dr
- 0 Cordova Rd Unit MDTA2011672
- 24383 Robins Creek Rd
- 32949 Reeses Landing Rd
- 32959 Reeses Landing Rd
- 0 Reese Landing Rd Unit MDTA136214
- 0 Reese Landing Rd Unit MDTA139112
- 10475 Tuckahoe Bow Dr
- 33000 Reeses Landing Rd
- 10591 Tuckahoe Bow Dr
- 10525 Tuckahoe Bow Dr
- 10545 Tuckahoe Bow Dr
- 32856 Reeses Landing Rd
- 32646 Hidden Acres Rd
- 10400 Highfield Rd
- 32602 Hidden Acres Rd
- 32741 Reeses Landing Rd
- 32737 Reeses Landing Rd
- 32733 Reeses Landing Rd
- 32705 Reeses Landing Rd
- 32510 Hidden Acres Rd
- 32636 Colby Rd
- 32661 Reeses Landing Rd