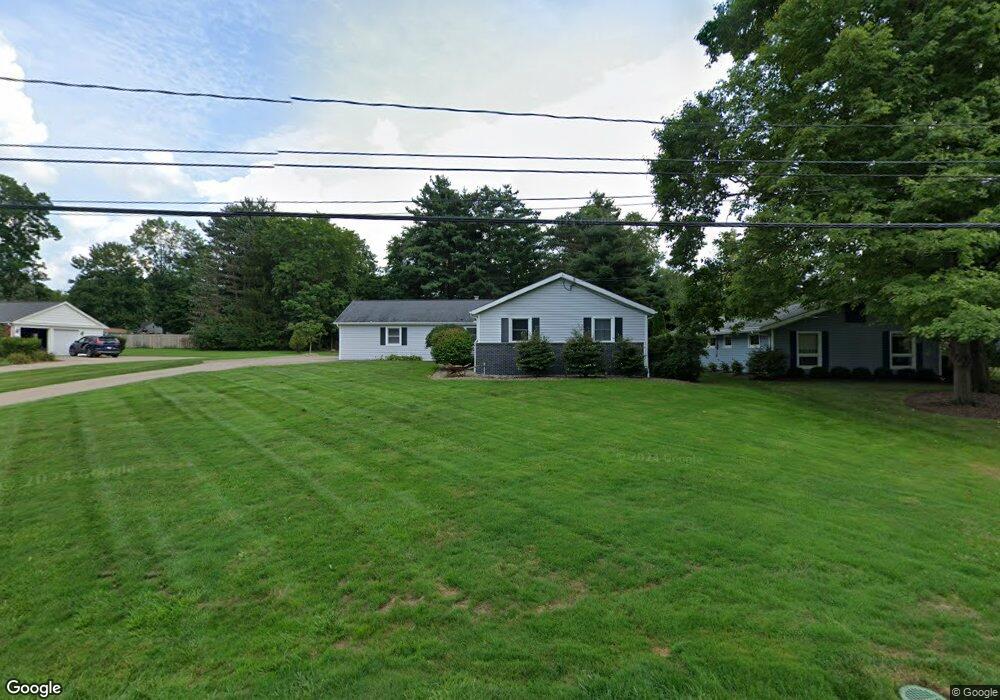
329 Aurora Hudson Rd Aurora, OH 44202
Estimated Value: $319,102 - $352,000
3
Beds
2
Baths
1,652
Sq Ft
$206/Sq Ft
Est. Value
About This Home
This home is located at 329 Aurora Hudson Rd, Aurora, OH 44202 and is currently estimated at $341,026, approximately $206 per square foot. 329 Aurora Hudson Rd is a home located in Portage County with nearby schools including Miller Elementary School, Leighton Elementary School, and Craddock/Miller Elementary School.
Ownership History
Date
Name
Owned For
Owner Type
Purchase Details
Closed on
Nov 13, 2018
Sold by
Friedler Scott H and Friedler Kimberly J
Bought by
Friedler Kimberly J
Current Estimated Value
Home Financials for this Owner
Home Financials are based on the most recent Mortgage that was taken out on this home.
Original Mortgage
$156,900
Outstanding Balance
$136,870
Interest Rate
4.8%
Mortgage Type
New Conventional
Estimated Equity
$204,156
Purchase Details
Closed on
Feb 18, 1999
Sold by
Wiman Noreen S
Bought by
Friedler Scott H and Friedler Kimberly J
Home Financials for this Owner
Home Financials are based on the most recent Mortgage that was taken out on this home.
Original Mortgage
$120,000
Interest Rate
6.92%
Purchase Details
Closed on
Jan 5, 1993
Bought by
Wiman Noreen S
Create a Home Valuation Report for This Property
The Home Valuation Report is an in-depth analysis detailing your home's value as well as a comparison with similar homes in the area
Home Values in the Area
Average Home Value in this Area
Purchase History
| Date | Buyer | Sale Price | Title Company |
|---|---|---|---|
| Friedler Kimberly J | -- | Title Source Inc | |
| Friedler Scott H | $150,000 | Acs Title | |
| Wiman Noreen S | -- | -- |
Source: Public Records
Mortgage History
| Date | Status | Borrower | Loan Amount |
|---|---|---|---|
| Open | Friedler Kimberly J | $156,900 | |
| Closed | Friedler Scott H | $120,000 |
Source: Public Records
Tax History
| Year | Tax Paid | Tax Assessment Tax Assessment Total Assessment is a certain percentage of the fair market value that is determined by local assessors to be the total taxable value of land and additions on the property. | Land | Improvement |
|---|---|---|---|---|
| 2024 | $4,589 | $102,660 | $14,950 | $87,710 |
| 2023 | $4,361 | $79,420 | $14,950 | $64,470 |
| 2022 | $3,949 | $79,420 | $14,950 | $64,470 |
| 2021 | $3,971 | $79,420 | $14,950 | $64,470 |
| 2020 | $3,541 | $66,120 | $14,950 | $51,170 |
| 2019 | $3,570 | $66,120 | $14,950 | $51,170 |
| 2018 | $3,389 | $57,060 | $14,950 | $42,110 |
| 2017 | $3,389 | $57,060 | $14,950 | $42,110 |
| 2016 | $3,053 | $57,060 | $14,950 | $42,110 |
| 2015 | $3,140 | $57,060 | $14,950 | $42,110 |
| 2014 | $3,135 | $55,830 | $14,950 | $40,880 |
| 2013 | $3,134 | $55,830 | $14,950 | $40,880 |
Source: Public Records
Map
Nearby Homes
- 270 Parkview Dr
- 750 Hampton Cir
- 510-11 Concord Downs Cir Unit 1K
- 504-9 Concord Downs Cir Unit 9
- 294 S Park Dr
- 830 S Parkview Dr
- 604 W Acadia Point
- 985 Goldenrod Trail Unit 16K
- 429-53 Honeysuckle Path
- 824 S Chillicothe Rd Unit 11
- 682 Arbor Way
- 711 Cross Creek Oval
- 0 W Mennonite Rd
- 800 Windward Dr Unit 37
- V/L W Garfield Rd
- 369 Fox Run Trail
- 123 S Chillicothe Rd
- 885 Sunrise Cir
- 984 Hawkin Ln
- 109 S Chillicothe Rd
- 319 Aurora Hudson Rd
- 335 Aurora Hudson Rd
- 292 Parkview Dr
- 282 Parkview Dr
- 298 Parkview Dr
- 274 Parkview Dr
- 309 Aurora Hudson Rd
- 266 Parkview Dr
- 320 Aurora Hudson Rd
- 346 Greenbriar Dr
- 352 Greenbriar Dr
- 305 Aurora Hudson Rd
- 338 Greenbriar Dr
- 334 Greenbriar Dr
- 340 Aurora Hudson Rd
- 295 Parkview Dr
- 258 Parkview Dr
- 289 Parkview Dr
- 303 Parkview Dr
- 275 Parkview Dr