Estimated Value: $241,000 - $268,351
3
Beds
2
Baths
1,887
Sq Ft
$133/Sq Ft
Est. Value
About This Home
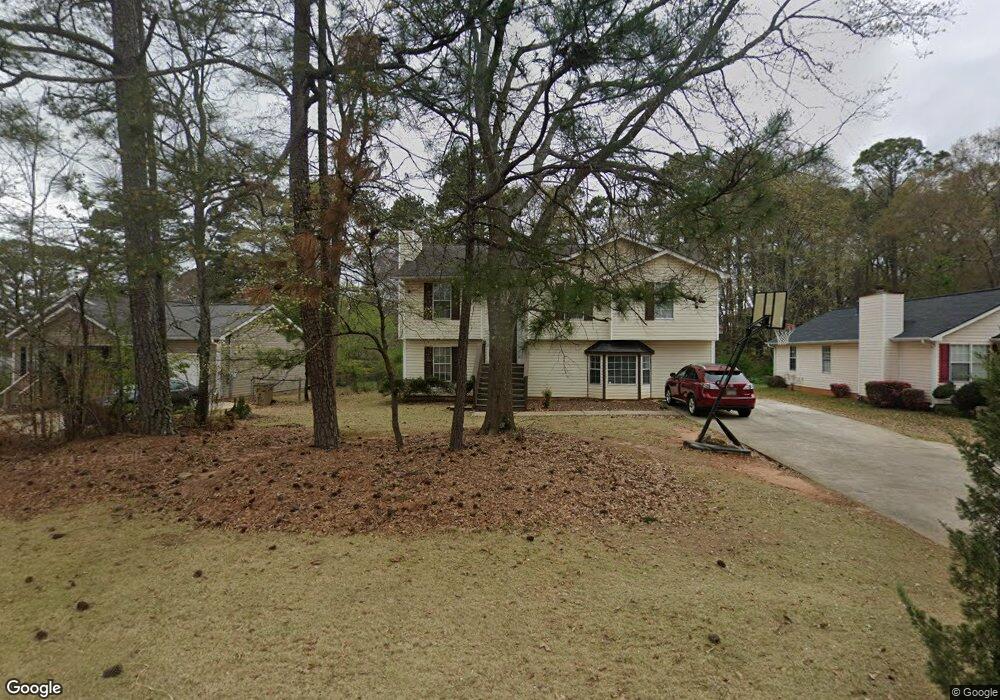
This home is located at 329 Barr Cir Unit IV, Rex, GA 30273 and is currently estimated at $251,838, approximately $133 per square foot. 329 Barr Cir Unit IV is a home located in Henry County with nearby schools including Fairview Elementary School, Austin Road Middle School, and Stockbridge High School.
Ownership History
Date
Name
Owned For
Owner Type
Purchase Details
Closed on
Dec 28, 2000
Sold by
Governo Louis
Bought by
Viar James M and Viar Susan L
Current Estimated Value
Home Financials for this Owner
Home Financials are based on the most recent Mortgage that was taken out on this home.
Original Mortgage
$91,200
Interest Rate
7.75%
Mortgage Type
New Conventional
Purchase Details
Closed on
Dec 26, 2000
Sold by
Viar James M and Viar Susan
Bought by
Robinson Marcus D and Robinson Kittisha D
Home Financials for this Owner
Home Financials are based on the most recent Mortgage that was taken out on this home.
Original Mortgage
$91,200
Interest Rate
7.75%
Mortgage Type
New Conventional
Purchase Details
Closed on
Aug 14, 2000
Sold by
Viar James M and Viar Susan L
Bought by
Governo Louis
Purchase Details
Closed on
Jun 26, 1996
Sold by
Reeves Homes
Bought by
Viar James M
Purchase Details
Closed on
Mar 11, 1996
Sold by
Cages George P
Bought by
Reeves Homes
Create a Home Valuation Report for This Property
The Home Valuation Report is an in-depth analysis detailing your home's value as well as a comparison with similar homes in the area
Home Values in the Area
Average Home Value in this Area
Purchase History
| Date | Buyer | Sale Price | Title Company |
|---|---|---|---|
| Viar James M | -- | -- | |
| Robinson Marcus D | $114,000 | -- | |
| Governo Louis | -- | -- | |
| Viar James M | $89,800 | -- | |
| Reeves Homes | $15,500 | -- |
Source: Public Records
Mortgage History
| Date | Status | Borrower | Loan Amount |
|---|---|---|---|
| Closed | Robinson Marcus D | $91,200 | |
| Closed | Reeves Homes | $0 |
Source: Public Records
Tax History Compared to Growth
Tax History
| Year | Tax Paid | Tax Assessment Tax Assessment Total Assessment is a certain percentage of the fair market value that is determined by local assessors to be the total taxable value of land and additions on the property. | Land | Improvement |
|---|---|---|---|---|
| 2025 | $2,812 | $103,068 | $14,000 | $89,068 |
| 2024 | $2,812 | $105,040 | $14,000 | $91,040 |
| 2023 | $2,418 | $103,840 | $14,000 | $89,840 |
| 2022 | $2,143 | $70,840 | $10,000 | $60,840 |
| 2021 | $1,596 | $56,120 | $10,000 | $46,120 |
| 2020 | $1,669 | $50,760 | $6,000 | $44,760 |
| 2019 | $1,412 | $42,840 | $6,000 | $36,840 |
| 2018 | $1,231 | $38,120 | $6,000 | $32,120 |
| 2016 | $1,205 | $37,440 | $4,800 | $32,640 |
| 2015 | $1,041 | $32,600 | $4,000 | $28,600 |
| 2014 | $874 | $28,200 | $4,000 | $24,200 |
Source: Public Records
Map
Nearby Homes
- 4301 Rex Rd Unit I
- 305 Belmont Farms Dr
- 245 Remington Trail
- 232 Clarkdell Dr
- 140 Triple Crown Ln
- 20 Roundup Place
- 115 Belmont Farms Dr
- 160 Leyland Cypress Way
- 2132 E Atlanta Rd
- 5904 Foxfield Trail
- The Brookwood Plan at Legacy at Stagecoach
- The Northview Plan at Legacy at Stagecoach
- The Thorton Plan at Legacy at Stagecoach
- The Lancaster Plan at Legacy at Stagecoach
- The Chadwick Plan at Legacy at Stagecoach
- The Yorkshire Plan at Legacy at Stagecoach
- The Donovan Plan at Legacy at Stagecoach
- The Cheshire Plan at Legacy at Stagecoach
- 5847 Pinetree Ln
- 3874 Rex Cir
- 333 Barr Cir Unit IV
- 325 Barr Cir
- 325 Barr Cir Unit 4
- 339 Barr Cir
- 3393 Barr Cir
- 145 Wagon Wheel Dr
- 319 Barr Cir Unit 4
- 135 Wagon Wheel Dr Unit 3
- 305 Barr Cir
- 305 Barr Cir Unit 10
- 125 Wagon Wheel Dr
- 345 Barr Cir
- 330 Barr Cir Unit IV
- 301 Barr Cir
- 334 Barr Cir
- 105 Wagon Wheel Dr
- 322 Barr Cir Unit 4
- 85 Wagon Wheel Dr
- 340 Barr Cir
- 340 Barr Cir