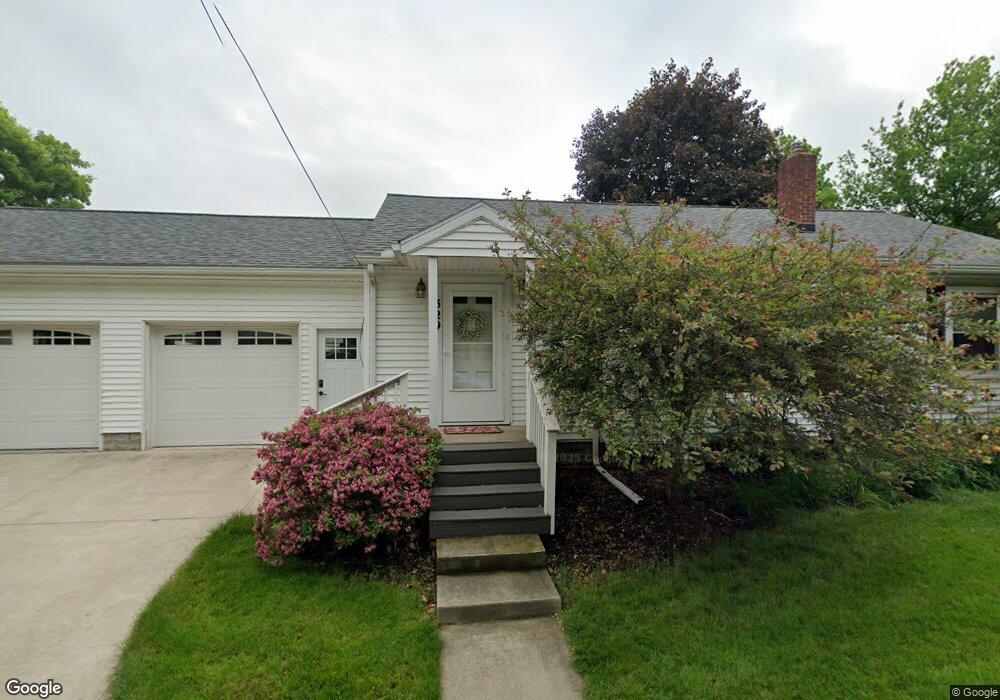
329 Congress St Elmore, OH 43416
Estimated Value: $137,000 - $151,000
3
Beds
2
Baths
1,014
Sq Ft
$145/Sq Ft
Est. Value
About This Home
This home is located at 329 Congress St, Elmore, OH 43416 and is currently estimated at $146,640, approximately $144 per square foot. 329 Congress St is a home located in Ottawa County with nearby schools including Woodmore Elementary School, Woodmore Middle School, and Solomon Lutheran School.
Ownership History
Date
Name
Owned For
Owner Type
Purchase Details
Closed on
Dec 20, 2021
Sold by
Paule Thomas L and Paule Julie J
Bought by
Burroughs Cade T
Current Estimated Value
Home Financials for this Owner
Home Financials are based on the most recent Mortgage that was taken out on this home.
Original Mortgage
$87,000
Outstanding Balance
$68,033
Interest Rate
2.35%
Mortgage Type
New Conventional
Estimated Equity
$78,607
Purchase Details
Closed on
May 26, 2015
Sold by
Drummond Constance J and Price Deanna L
Bought by
Pauline Thomas L and Paule Julie J
Purchase Details
Closed on
Jul 21, 2003
Sold by
Martin Marlene J
Bought by
Troknya Juanita
Home Financials for this Owner
Home Financials are based on the most recent Mortgage that was taken out on this home.
Original Mortgage
$109,439
Interest Rate
5.37%
Mortgage Type
Purchase Money Mortgage
Create a Home Valuation Report for This Property
The Home Valuation Report is an in-depth analysis detailing your home's value as well as a comparison with similar homes in the area
Home Values in the Area
Average Home Value in this Area
Purchase History
| Date | Buyer | Sale Price | Title Company |
|---|---|---|---|
| Burroughs Cade T | $108,750 | Cottrell Ernest E | |
| Pauline Thomas L | $86,000 | Attorney | |
| Troknya Juanita | $110,000 | -- |
Source: Public Records
Mortgage History
| Date | Status | Borrower | Loan Amount |
|---|---|---|---|
| Open | Burroughs Cade T | $87,000 | |
| Previous Owner | Troknya Juanita | $109,439 |
Source: Public Records
Tax History Compared to Growth
Tax History
| Year | Tax Paid | Tax Assessment Tax Assessment Total Assessment is a certain percentage of the fair market value that is determined by local assessors to be the total taxable value of land and additions on the property. | Land | Improvement |
|---|---|---|---|---|
| 2024 | $1,882 | $34,577 | $9,072 | $25,505 |
| 2023 | $1,882 | $29,418 | $6,720 | $22,698 |
| 2022 | $1,724 | $29,418 | $6,720 | $22,698 |
| 2021 | $1,694 | $29,420 | $6,720 | $22,700 |
| 2020 | $1,578 | $25,970 | $6,720 | $19,250 |
| 2019 | $1,557 | $25,970 | $6,720 | $19,250 |
| 2018 | $1,539 | $25,970 | $6,720 | $19,250 |
| 2017 | $1,499 | $25,140 | $6,720 | $18,420 |
| 2016 | $1,466 | $25,140 | $6,720 | $18,420 |
| 2015 | $1,559 | $25,140 | $6,720 | $18,420 |
| 2014 | $771 | $24,140 | $6,720 | $17,420 |
| 2013 | $772 | $24,140 | $6,720 | $17,420 |
Source: Public Records
Map
Nearby Homes
- 0 W Portage River Rd S Unit 6130453
- 20240 W Portage River South Rd
- 19383 Courtland Ave
- 110 E 1st St
- 212 S Perry St
- 219 Lime St
- 612 W Main St
- 2574 County Road 74
- 739 Riverside Dr
- 421 Parklane Dr
- 571 Parklane Dr
- 514 West St
- 904 Main St
- 207 E 11th St
- 510 Wilson St
- 1350 N Genoa Clay Center Rd
- 1301 West St
- 416 Castle Cove
- 1861 N Opfer-Lentz Rd
- 14878 W State Route 163