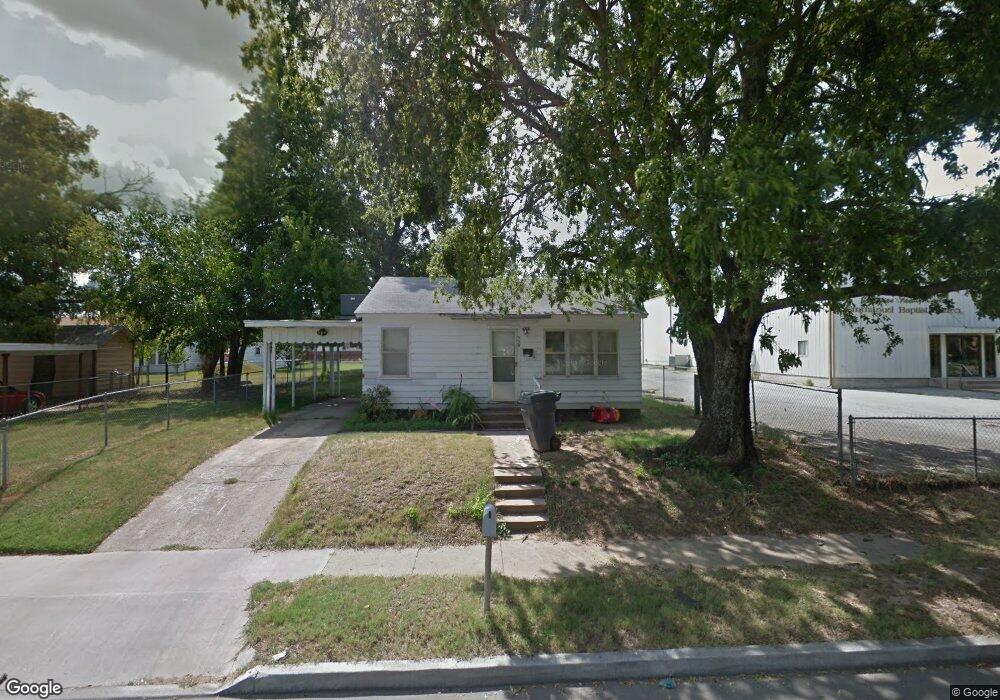
329 D St SE Ardmore, OK 73401
Estimated Value: $62,000 - $76,543
2
Beds
1
Bath
805
Sq Ft
$83/Sq Ft
Est. Value
About This Home
This home is located at 329 D St SE, Ardmore, OK 73401 and is currently estimated at $66,886, approximately $83 per square foot. 329 D St SE is a home located in Carter County with nearby schools including Jefferson Elementary School, Ardmore Middle School, and Ardmore High School.
Ownership History
Date
Name
Owned For
Owner Type
Purchase Details
Closed on
Sep 22, 2011
Sold by
Emmanuel Baptist Church Of Ardmore Inc
Bought by
Rdw Properties Llc
Current Estimated Value
Home Financials for this Owner
Home Financials are based on the most recent Mortgage that was taken out on this home.
Original Mortgage
$27,208
Interest Rate
4.34%
Mortgage Type
Unknown
Purchase Details
Closed on
Oct 13, 1997
Sold by
Follis Jerry Son
Bought by
Julian Harold M and Julian Phy
Purchase Details
Closed on
Jan 14, 1994
Sold by
Banks Hattie V
Bought by
Follis Jerry Son
Create a Home Valuation Report for This Property
The Home Valuation Report is an in-depth analysis detailing your home's value as well as a comparison with similar homes in the area
Home Values in the Area
Average Home Value in this Area
Purchase History
| Date | Buyer | Sale Price | Title Company |
|---|---|---|---|
| Rdw Properties Llc | $33,000 | None Available | |
| Julian Harold M | $21,500 | -- | |
| Follis Jerry Son | -- | -- |
Source: Public Records
Mortgage History
| Date | Status | Borrower | Loan Amount |
|---|---|---|---|
| Closed | Rdw Properties Llc | $27,208 |
Source: Public Records
Tax History Compared to Growth
Tax History
| Year | Tax Paid | Tax Assessment Tax Assessment Total Assessment is a certain percentage of the fair market value that is determined by local assessors to be the total taxable value of land and additions on the property. | Land | Improvement |
|---|---|---|---|---|
| 2024 | $365 | $3,696 | $546 | $3,150 |
| 2023 | $347 | $3,520 | $533 | $2,987 |
| 2022 | $321 | $3,353 | $519 | $2,834 |
| 2021 | $322 | $3,193 | $501 | $2,692 |
| 2020 | $302 | $3,041 | $480 | $2,561 |
| 2019 | $295 | $3,041 | $480 | $2,561 |
| 2018 | $300 | $3,041 | $480 | $2,561 |
| 2017 | $290 | $3,168 | $480 | $2,688 |
| 2016 | $324 | $3,477 | $480 | $2,997 |
| 2015 | $265 | $3,452 | $159 | $3,293 |
| 2014 | $285 | $3,706 | $159 | $3,547 |
Source: Public Records
Map
Nearby Homes