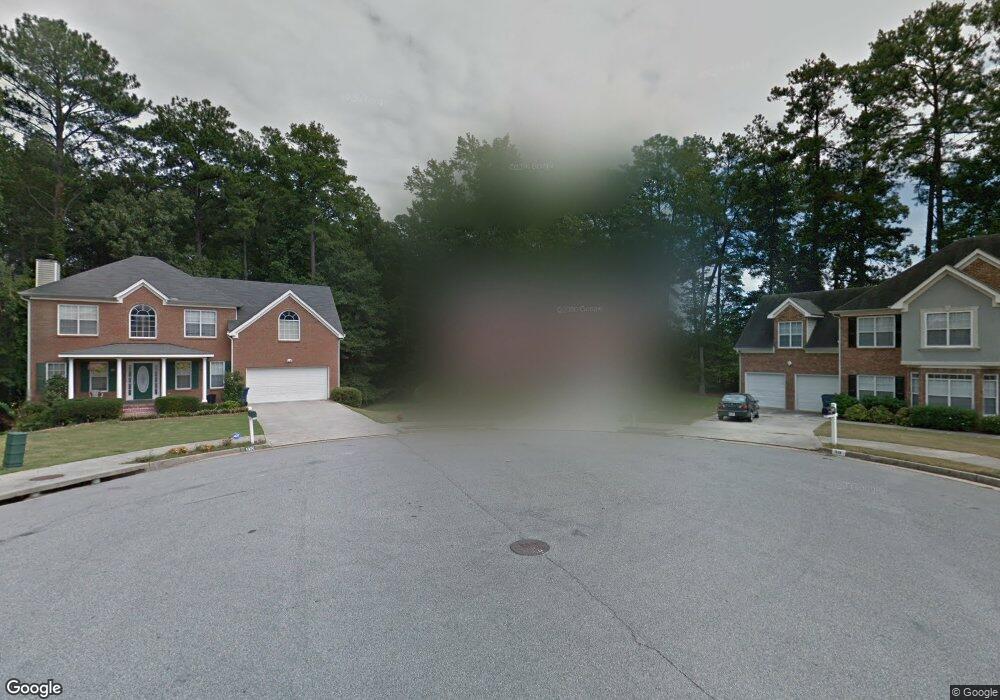
329 Derby Dr Riverdale, GA 30274
Estimated Value: $223,534 - $338,000
4
Beds
3
Baths
1,904
Sq Ft
$151/Sq Ft
Est. Value
About This Home
This home is located at 329 Derby Dr, Riverdale, GA 30274 and is currently estimated at $287,884, approximately $151 per square foot. 329 Derby Dr is a home located in Clayton County with nearby schools including Callaway Elementary School, Kendrick Middle School, and Riverdale High School.
Ownership History
Date
Name
Owned For
Owner Type
Purchase Details
Closed on
Aug 31, 2006
Sold by
Wm Speciality Mtg Llc
Bought by
Zackery Adrienne
Current Estimated Value
Home Financials for this Owner
Home Financials are based on the most recent Mortgage that was taken out on this home.
Original Mortgage
$167,500
Interest Rate
6.58%
Mortgage Type
New Conventional
Purchase Details
Closed on
Aug 21, 2006
Sold by
W M Specialty Mtg Llc
Bought by
Zakery Adriene
Home Financials for this Owner
Home Financials are based on the most recent Mortgage that was taken out on this home.
Original Mortgage
$167,500
Interest Rate
6.58%
Mortgage Type
New Conventional
Purchase Details
Closed on
Mar 7, 2006
Sold by
Muhammad John
Bought by
Wmc Specialty Mtg Llc
Purchase Details
Closed on
May 31, 2000
Sold by
Tara Construction
Bought by
Muhammed John
Home Financials for this Owner
Home Financials are based on the most recent Mortgage that was taken out on this home.
Original Mortgage
$159,600
Interest Rate
10.99%
Mortgage Type
New Conventional
Create a Home Valuation Report for This Property
The Home Valuation Report is an in-depth analysis detailing your home's value as well as a comparison with similar homes in the area
Home Values in the Area
Average Home Value in this Area
Purchase History
| Date | Buyer | Sale Price | Title Company |
|---|---|---|---|
| Zackery Adrienne | -- | -- | |
| Zakery Adriene | $167,500 | -- | |
| Wmc Specialty Mtg Llc | $202,500 | -- | |
| Muhammed John | $199,500 | -- |
Source: Public Records
Mortgage History
| Date | Status | Borrower | Loan Amount |
|---|---|---|---|
| Previous Owner | Zakery Adriene | $167,500 | |
| Previous Owner | Muhammed John | $159,600 |
Source: Public Records
Tax History Compared to Growth
Tax History
| Year | Tax Paid | Tax Assessment Tax Assessment Total Assessment is a certain percentage of the fair market value that is determined by local assessors to be the total taxable value of land and additions on the property. | Land | Improvement |
|---|---|---|---|---|
| 2024 | $399 | $20,240 | $8,800 | $11,440 |
| 2023 | $647 | $20,240 | $8,800 | $11,440 |
| 2022 | $2,939 | $95,200 | $8,800 | $86,400 |
| 2021 | $2,354 | $77,760 | $8,800 | $68,960 |
| 2020 | $1,661 | $67,470 | $8,800 | $58,670 |
| 2019 | $1,801 | $60,606 | $9,200 | $51,406 |
| 2018 | $1,519 | $52,672 | $9,200 | $43,472 |
| 2017 | $753 | $48,813 | $9,200 | $39,613 |
| 2016 | $1,176 | $42,945 | $9,200 | $33,745 |
| 2015 | $1,011 | $0 | $0 | $0 |
| 2014 | $1,064 | $40,581 | $9,200 | $31,381 |
Source: Public Records
Map
Nearby Homes
- 38 Rockport Dr
- 8043 Sparrow Ct
- 7934 Lundy Ct
- 246 Saddleview Trail
- 51 Rountree Rd
- 82 Heron Dr
- 0 Taylor Rd Unit 10093638
- 45 Heron Dr
- 8169 Kendrick Rd
- 36 Highway 138 SW
- 7804 Chase Woods Dr
- 96 Sedgefield Dr
- 80 Rountree Rd
- 8221 Queens Dr
- 7755 Chase Woods Dr
- 7807 Park Ln
- 7845 Chase Woods Dr
- 7899 Taylor Downs Way
- 8229 Queens Dr
- 8219 Canyon Forge Dr
- 330 Derby Dr
- 321 Derby Dr
- 322 Derby Dr
- 313 Derby Dr
- 318 Derby Dr
- 310 Derby Dr
- 305 Derby Dr
- 10 Rockport Dr
- 302 Derby Dr
- 42 Chipping Ct
- 0 Chipping Ct Unit 7084599
- 0 Chipping Ct Unit 3285963
- 0 Chipping Ct
- 50 Chipping Ct
- 297 Derby Dr
- 7938 Stanebrook Dr
- 20 Rockport Dr
- 294 Derby Dr
- 7922 Abington Dr
- 41 Chipping Ct