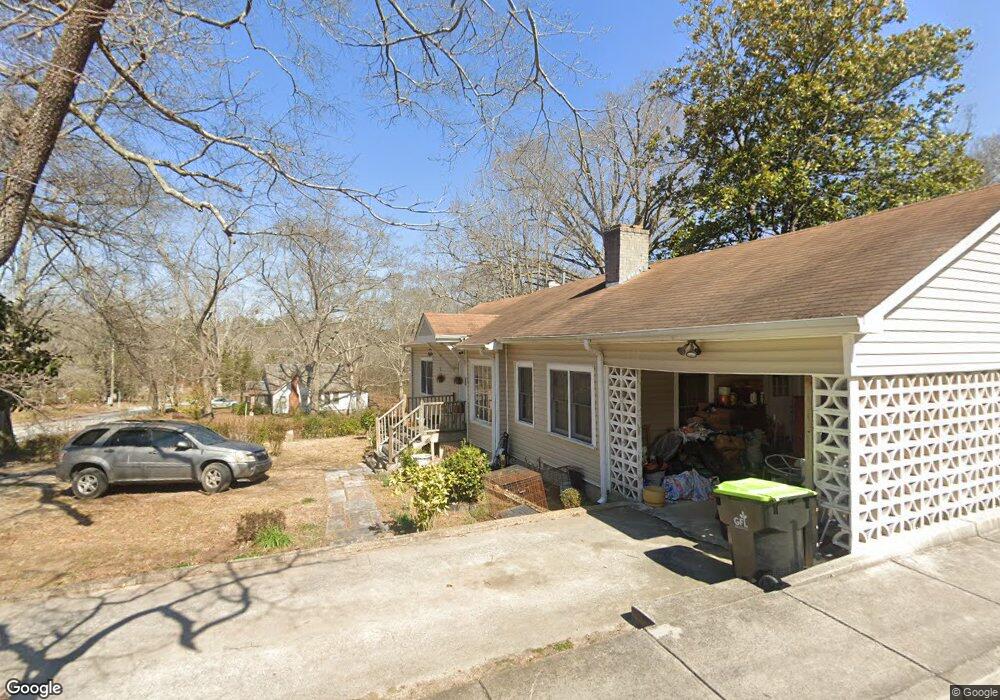
329 Elm Dr Villa Rica, GA 30180
Estimated Value: $166,000 - $216,000
2
Beds
1
Bath
1,214
Sq Ft
$154/Sq Ft
Est. Value
About This Home
This home is located at 329 Elm Dr, Villa Rica, GA 30180 and is currently estimated at $187,551, approximately $154 per square foot. 329 Elm Dr is a home located in Carroll County with nearby schools including Glanton-Hindsman Elementary School, Villa Rica Middle School, and Villa Rica High School.
Ownership History
Date
Name
Owned For
Owner Type
Purchase Details
Closed on
Jun 23, 2020
Sold by
Hitchcock D L
Bought by
Grier Perry
Current Estimated Value
Home Financials for this Owner
Home Financials are based on the most recent Mortgage that was taken out on this home.
Original Mortgage
$85,000
Outstanding Balance
$75,204
Interest Rate
3.1%
Mortgage Type
VA
Estimated Equity
$112,347
Purchase Details
Closed on
Jun 21, 2016
Sold by
Churchill Carolyn M
Bought by
Hitchcock D L and Churchill Carolyn M
Purchase Details
Closed on
Jun 6, 2007
Sold by
Not Provided
Bought by
Churchill Carolyn M
Purchase Details
Closed on
Aug 23, 2002
Sold by
Taylor Helen C
Bought by
Hitchcock D L
Purchase Details
Closed on
May 17, 2000
Sold by
Taylor C F
Bought by
Taylor Helen C
Purchase Details
Closed on
Jun 27, 1994
Bought by
Taylor Taylor C and Taylor Myrl
Purchase Details
Closed on
Sep 13, 1984
Sold by
Taylor Taylor C and Taylor Myrl
Bought by
Taylor C F
Create a Home Valuation Report for This Property
The Home Valuation Report is an in-depth analysis detailing your home's value as well as a comparison with similar homes in the area
Home Values in the Area
Average Home Value in this Area
Purchase History
| Date | Buyer | Sale Price | Title Company |
|---|---|---|---|
| Grier Perry | $85,000 | -- | |
| Hitchcock D L | -- | -- | |
| Churchill Carolyn M | -- | -- | |
| Hitchcock D L | $65,000 | -- | |
| Taylor Helen C | -- | -- | |
| Taylor Helen C | -- | -- | |
| Taylor Taylor C | -- | -- | |
| Taylor C F | -- | -- |
Source: Public Records
Mortgage History
| Date | Status | Borrower | Loan Amount |
|---|---|---|---|
| Open | Grier Perry | $85,000 |
Source: Public Records
Tax History Compared to Growth
Tax History
| Year | Tax Paid | Tax Assessment Tax Assessment Total Assessment is a certain percentage of the fair market value that is determined by local assessors to be the total taxable value of land and additions on the property. | Land | Improvement |
|---|---|---|---|---|
| 2024 | $1,770 | $62,739 | $11,404 | $51,335 |
| 2023 | $1,770 | $58,500 | $11,405 | $47,095 |
| 2022 | $1,423 | $45,417 | $7,603 | $37,814 |
| 2021 | $1,084 | $38,570 | $5,632 | $32,938 |
| 2020 | $1,117 | $35,002 | $5,632 | $29,370 |
| 2019 | $1,035 | $32,741 | $5,632 | $27,109 |
| 2018 | $876 | $27,110 | $6,400 | $20,710 |
| 2017 | $887 | $27,110 | $6,400 | $20,710 |
| 2016 | $891 | $27,110 | $6,400 | $20,710 |
| 2015 | $918 | $26,650 | $8,000 | $18,650 |
| 2014 | $925 | $26,650 | $8,000 | $18,650 |
Source: Public Records
Map
Nearby Homes
- 506 Northside Place
- 113 W Gordon St
- 224 Crest Creek Way
- 413 Dallas Hwy
- 0 Church Ln Unit 10633475
- 0 Church Ln Unit 7673213
- 0 Church Ln Unit 155
- 212 Rockmart Rd
- 1395 Georgia 61
- 1385 Georgia 61
- 208 N North Dogwood St
- 208 N Dogwood St
- 915 Sundown Point
- 913 Sundown Point
- 0 White St
- 318 N Dogwood St
- 162 Parkway Cir
- 511 Reid St
- 25 Stoneway Dr
- Woodbury Plan at The Fairways at Mirror Lake
- 323 Elm Cir
- 323 Elm Cir
- 0 Anderson Rd
- 0 Anderson Rd Unit 7103447
- 0 Anderson Rd Unit 3012511
- 333 Elm Cir
- 331 North Ave
- 331 North Ave
- 333 Elm Dr
- 335 North Ave
- 315 Anderson Rd
- 337 Elm Dr
- 318 Elm Dr
- 319 Elm Cir
- 319 Elm Ct
- 0 Elm Dr Unit 8731763
- 0 Elm Dr Unit 7504049
- 0 Elm Dr Unit 7064971
- 0 Elm Dr Unit 3207409
- 0 Elm Dr Unit 8065247