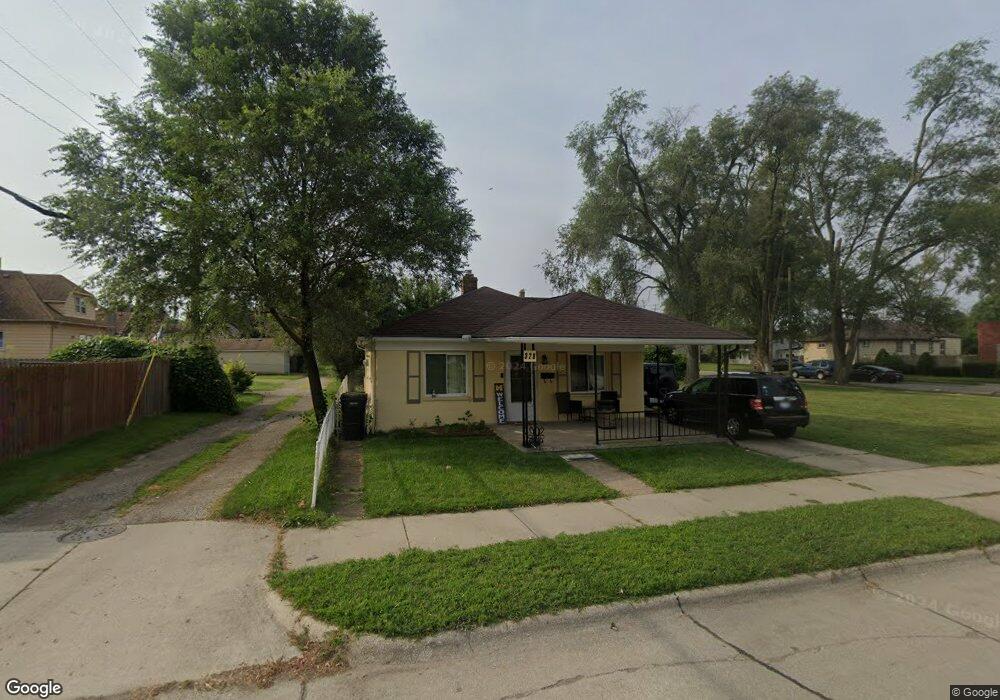
329 Goodell St Unit Bldg-Unit Wyandotte, MI 48192
Estimated Value: $135,000 - $180,108
--
Bed
1
Bath
923
Sq Ft
$172/Sq Ft
Est. Value
About This Home
This home is located at 329 Goodell St Unit Bldg-Unit, Wyandotte, MI 48192 and is currently estimated at $159,027, approximately $172 per square foot. 329 Goodell St Unit Bldg-Unit is a home located in Wayne County with nearby schools including James A. Garfield Elementary School, Woodrow Wilson School, and Roosevelt High School.
Ownership History
Date
Name
Owned For
Owner Type
Purchase Details
Closed on
Dec 24, 2019
Sold by
Hall Maria and Noto Suelly
Bought by
Antio Tyler M
Current Estimated Value
Home Financials for this Owner
Home Financials are based on the most recent Mortgage that was taken out on this home.
Original Mortgage
$82,100
Outstanding Balance
$72,383
Interest Rate
3.6%
Mortgage Type
New Conventional
Estimated Equity
$86,644
Purchase Details
Closed on
Jun 25, 2018
Sold by
Moore Karen G
Bought by
Hall Maria
Create a Home Valuation Report for This Property
The Home Valuation Report is an in-depth analysis detailing your home's value as well as a comparison with similar homes in the area
Home Values in the Area
Average Home Value in this Area
Purchase History
| Date | Buyer | Sale Price | Title Company |
|---|---|---|---|
| Antio Tyler M | $93,000 | Michigan Title Ins Agcy Inc | |
| Hall Maria | $52,200 | Michigan Title Ins Agcy Inc |
Source: Public Records
Mortgage History
| Date | Status | Borrower | Loan Amount |
|---|---|---|---|
| Open | Antio Tyler M | $82,100 |
Source: Public Records
Tax History Compared to Growth
Tax History
| Year | Tax Paid | Tax Assessment Tax Assessment Total Assessment is a certain percentage of the fair market value that is determined by local assessors to be the total taxable value of land and additions on the property. | Land | Improvement |
|---|---|---|---|---|
| 2025 | $2,235 | $84,000 | $0 | $0 |
| 2024 | $2,235 | $74,700 | $0 | $0 |
| 2023 | $2,131 | $66,500 | $0 | $0 |
| 2022 | $2,469 | $59,000 | $0 | $0 |
| 2021 | $2,419 | $50,800 | $0 | $0 |
| 2020 | $2,386 | $43,700 | $0 | $0 |
| 2019 | $2,337 | $42,600 | $0 | $0 |
| 2018 | $1,864 | $38,100 | $0 | $0 |
| 2017 | $679 | $38,100 | $0 | $0 |
| 2016 | $1,874 | $38,100 | $0 | $0 |
| 2015 | $3,344 | $35,400 | $0 | $0 |
| 2013 | $3,240 | $32,400 | $0 | $0 |
| 2012 | $1,515 | $33,900 | $5,500 | $28,400 |
Source: Public Records
Map
Nearby Homes