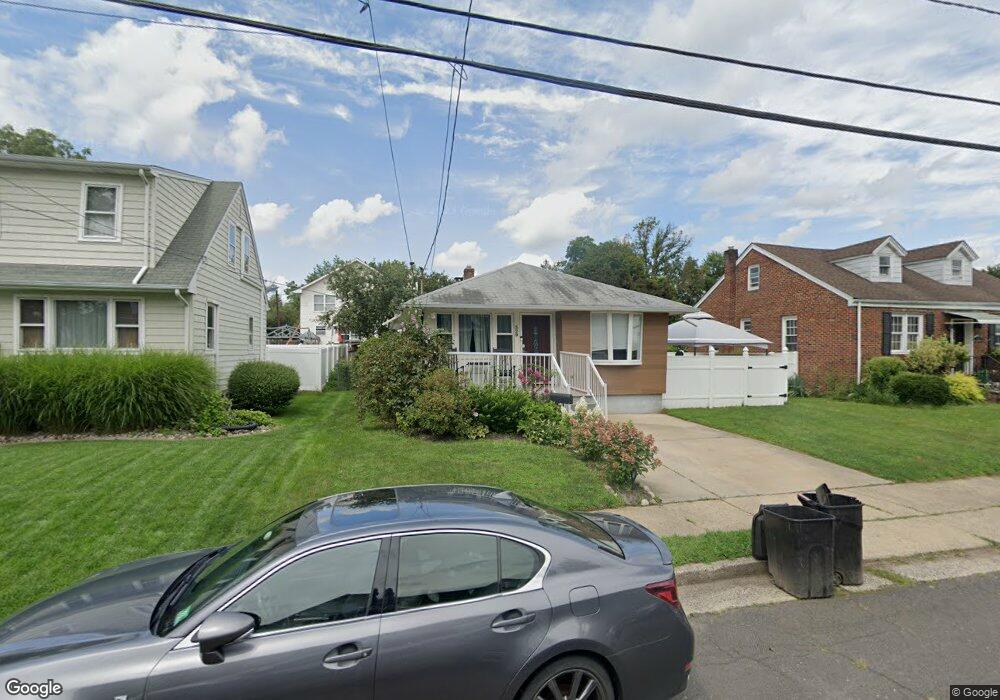
329 Huff Ave Manville, NJ 08835
Estimated Value: $362,000 - $437,000
--
Bed
--
Bath
1,126
Sq Ft
$345/Sq Ft
Est. Value
About This Home
This home is located at 329 Huff Ave, Manville, NJ 08835 and is currently estimated at $388,850, approximately $345 per square foot. 329 Huff Ave is a home located in Somerset County with nearby schools including Weston Elementary School, Roosevelt School, and Alexander Batcho Intermediate School (ABIS).
Ownership History
Date
Name
Owned For
Owner Type
Purchase Details
Closed on
Dec 9, 2022
Sold by
Zala Marcin
Bought by
Nyc Katarzyna
Current Estimated Value
Purchase Details
Closed on
Oct 31, 2007
Sold by
Rager Albert T and Ahlbrandt Nancy A
Bought by
Zala Marcin and Zala Katarzyna
Home Financials for this Owner
Home Financials are based on the most recent Mortgage that was taken out on this home.
Original Mortgage
$196,000
Interest Rate
6.43%
Mortgage Type
Purchase Money Mortgage
Purchase Details
Closed on
May 30, 1995
Sold by
Murray Kim
Bought by
Rager Albert and Ahlbrandt Nancy
Home Financials for this Owner
Home Financials are based on the most recent Mortgage that was taken out on this home.
Original Mortgage
$119,000
Interest Rate
8.21%
Create a Home Valuation Report for This Property
The Home Valuation Report is an in-depth analysis detailing your home's value as well as a comparison with similar homes in the area
Home Values in the Area
Average Home Value in this Area
Purchase History
| Date | Buyer | Sale Price | Title Company |
|---|---|---|---|
| Nyc Katarzyna | -- | -- | |
| Zala Marcin | $245,000 | None Available | |
| Rager Albert | $135,000 | -- |
Source: Public Records
Mortgage History
| Date | Status | Borrower | Loan Amount |
|---|---|---|---|
| Previous Owner | Zala Marcin | $196,000 | |
| Previous Owner | Rager Albert | $119,000 |
Source: Public Records
Tax History Compared to Growth
Tax History
| Year | Tax Paid | Tax Assessment Tax Assessment Total Assessment is a certain percentage of the fair market value that is determined by local assessors to be the total taxable value of land and additions on the property. | Land | Improvement |
|---|---|---|---|---|
| 2025 | $6,679 | $327,000 | $186,000 | $141,000 |
| 2024 | $6,679 | $296,700 | $156,000 | $140,700 |
| 2023 | $6,524 | $271,400 | $134,000 | $137,400 |
| 2022 | $5,637 | $215,500 | $86,500 | $129,000 |
| 2021 | $6,023 | $203,700 | $86,500 | $117,200 |
| 2020 | $5,797 | $184,100 | $72,200 | $111,900 |
| 2019 | $5,707 | $174,700 | $72,200 | $102,500 |
| 2018 | $6,017 | $184,000 | $79,800 | $104,200 |
| 2017 | $5,975 | $185,900 | $81,700 | $104,200 |
| 2016 | $5,759 | $185,900 | $81,700 | $104,200 |
| 2015 | $4,351 | $180,000 | $100,000 | $80,000 |
| 2014 | $4,264 | $180,000 | $100,000 | $80,000 |
Source: Public Records
Map
Nearby Homes