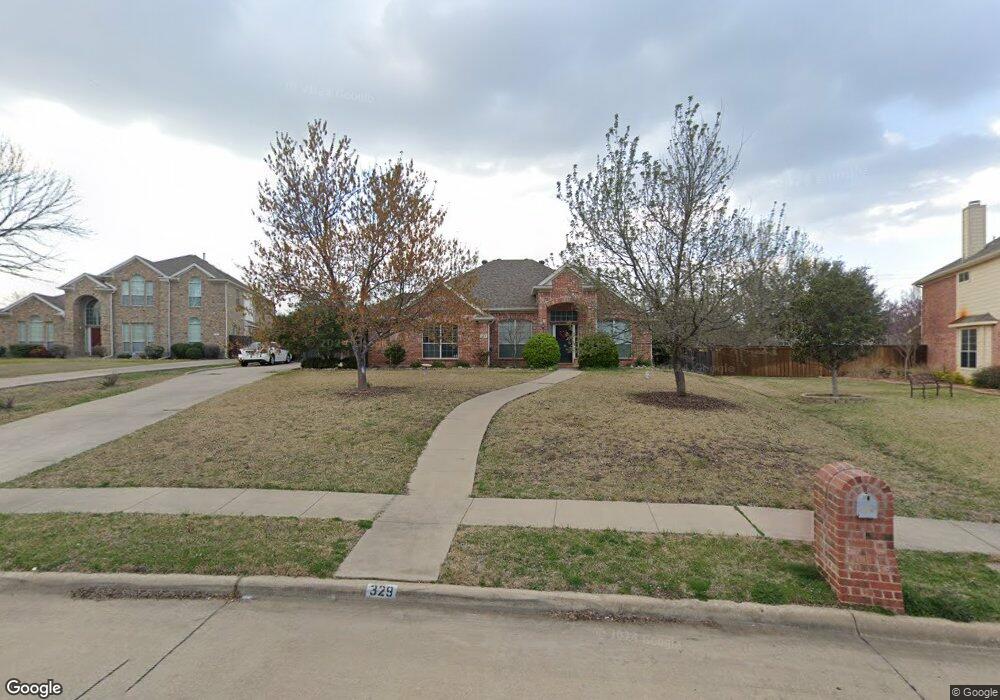
329 Love Bird Ln Murphy, TX 75094
Estimated Value: $529,093 - $555,000
4
Beds
2
Baths
2,210
Sq Ft
$243/Sq Ft
Est. Value
About This Home
This home is located at 329 Love Bird Ln, Murphy, TX 75094 and is currently estimated at $537,773, approximately $243 per square foot. 329 Love Bird Ln is a home located in Collin County with nearby schools including Don Whitt Elementary School, Dr. Al Draper Intermediate Middle School, and Raymond B Cooper J High School.
Ownership History
Date
Name
Owned For
Owner Type
Purchase Details
Closed on
Oct 23, 2020
Sold by
Gilley Cynthia M
Bought by
Gilley Jacob A and Gilley Cynthia M
Current Estimated Value
Purchase Details
Closed on
Jan 27, 2011
Sold by
Zuerker John C and Zuerker Amanda Mullins
Bought by
Gilley Cynthia M
Home Financials for this Owner
Home Financials are based on the most recent Mortgage that was taken out on this home.
Original Mortgage
$210,900
Outstanding Balance
$144,724
Interest Rate
4.84%
Mortgage Type
New Conventional
Estimated Equity
$393,049
Purchase Details
Closed on
Dec 23, 2003
Sold by
Legacy/Monterey Homes
Bought by
Zuerker John C and Zuerker Amanda Mullins
Home Financials for this Owner
Home Financials are based on the most recent Mortgage that was taken out on this home.
Original Mortgage
$196,634
Interest Rate
6.02%
Mortgage Type
Purchase Money Mortgage
Create a Home Valuation Report for This Property
The Home Valuation Report is an in-depth analysis detailing your home's value as well as a comparison with similar homes in the area
Home Values in the Area
Average Home Value in this Area
Purchase History
| Date | Buyer | Sale Price | Title Company |
|---|---|---|---|
| Gilley Jacob A | -- | Chicago Title | |
| Gilley Cynthia M | -- | Lawyers Title | |
| Zuerker John C | -- | -- |
Source: Public Records
Mortgage History
| Date | Status | Borrower | Loan Amount |
|---|---|---|---|
| Open | Gilley Cynthia M | $210,900 | |
| Previous Owner | Zuerker John C | $196,634 |
Source: Public Records
Tax History Compared to Growth
Tax History
| Year | Tax Paid | Tax Assessment Tax Assessment Total Assessment is a certain percentage of the fair market value that is determined by local assessors to be the total taxable value of land and additions on the property. | Land | Improvement |
|---|---|---|---|---|
| 2025 | $7,398 | $516,602 | $180,000 | $336,602 |
| 2024 | $7,398 | $484,420 | $144,000 | $391,709 |
| 2023 | $7,398 | $440,382 | $144,000 | $353,392 |
| 2022 | $8,394 | $400,347 | $132,000 | $337,054 |
| 2021 | $7,870 | $357,056 | $96,000 | $261,056 |
| 2020 | $7,225 | $315,540 | $96,000 | $219,540 |
| 2019 | $7,424 | $310,352 | $96,000 | $214,352 |
| 2018 | $7,153 | $296,548 | $96,000 | $200,548 |
| 2017 | $6,830 | $286,845 | $84,000 | $202,845 |
| 2016 | $6,280 | $268,136 | $84,000 | $184,136 |
| 2015 | $5,212 | $231,505 | $66,000 | $165,505 |
Source: Public Records
Map
Nearby Homes
- 403 Pleasant Run
- 179 Moonlight Dr
- 7117 Abilene Dr
- 2603 Grant Dr
- 7319 Crane Dr
- 7307 Crane Dr
- 7022 Cottonwood Cir
- 7010 Cottonwood Cir
- 2720 Ranchview Dr
- 6905 Wilhelmina Dr
- 3203 Grantham Dr
- 2011 Cori Place
- 2006 Cori Place
- 2911 Tracy Lynn Ln
- 2415 Green Meadow Dr
- 602 Horizon Dr
- 813 Burgess Ln
- 3309 Grantham Dr
- 7612 Cindy Ln
- 6925 Dewitt Rd
- 327 Love Bird Ln
- 331 Love Bird Ln
- 325 Love Bird Ln
- 335 Love Bird Ln
- 328 Love Bird Ln
- 166 Moonlight Dr
- 323 Love Bird Ln
- 170 Moonlight Dr
- 332 Love Bird Ln
- 162 Moonlight Dr
- 324 Love Bird Ln
- 336 Love Bird Ln
- 174 Moonlight Dr
- 321 Love Bird Ln
- 339 Love Bird Ln
- 158 Moonlight Dr
- 261 Love Bird Ln
- 320 Love Bird Ln
- 263 Love Bird Ln
- 340 Love Bird Ln