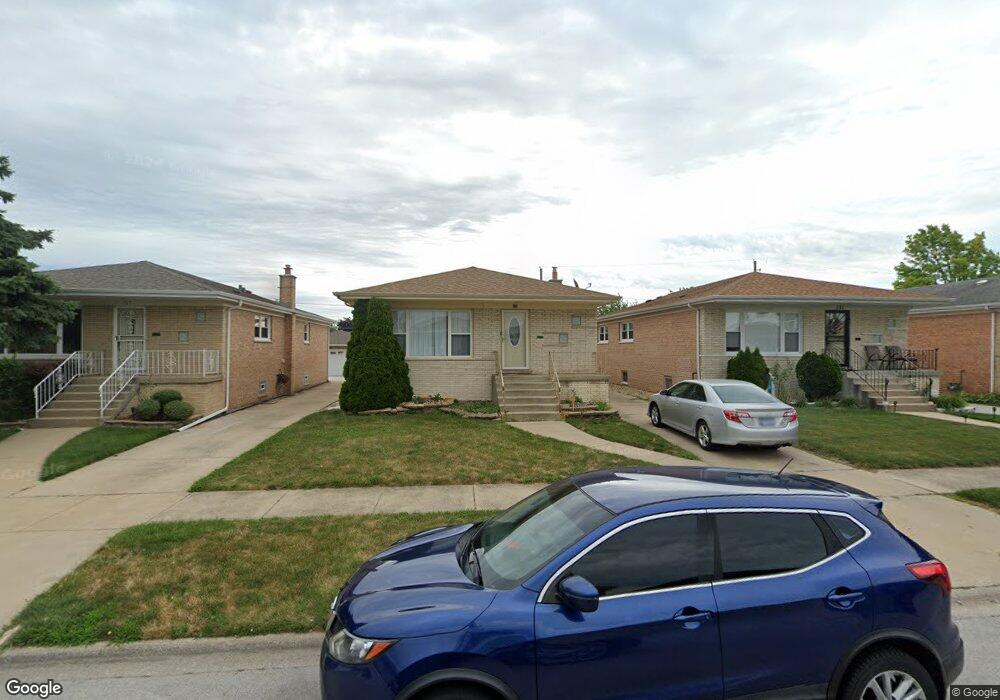
329 Manistee Ave Calumet City, IL 60409
Estimated Value: $199,571 - $261,000
3
Beds
2
Baths
1,323
Sq Ft
$173/Sq Ft
Est. Value
About This Home
This home is located at 329 Manistee Ave, Calumet City, IL 60409 and is currently estimated at $228,893, approximately $173 per square foot. 329 Manistee Ave is a home located in Cook County with nearby schools including Wilson Elementary School, Wentworth Intermediate School, and Wentworth Jr High School.
Ownership History
Date
Name
Owned For
Owner Type
Purchase Details
Closed on
Aug 30, 2017
Sold by
Harrison Shantal N
Bought by
Hall Corrine K and Jones Gloria M
Current Estimated Value
Home Financials for this Owner
Home Financials are based on the most recent Mortgage that was taken out on this home.
Original Mortgage
$127,645
Interest Rate
5.5%
Mortgage Type
FHA
Purchase Details
Closed on
Jul 26, 2006
Sold by
Coleman Josephine
Bought by
Harrison Shantal N
Home Financials for this Owner
Home Financials are based on the most recent Mortgage that was taken out on this home.
Original Mortgage
$116,000
Interest Rate
6.85%
Mortgage Type
Unknown
Purchase Details
Closed on
May 16, 1994
Sold by
Truesdale James L and Truesdale Carol M
Bought by
Coleman Josephine
Home Financials for this Owner
Home Financials are based on the most recent Mortgage that was taken out on this home.
Original Mortgage
$70,000
Interest Rate
8.58%
Create a Home Valuation Report for This Property
The Home Valuation Report is an in-depth analysis detailing your home's value as well as a comparison with similar homes in the area
Home Values in the Area
Average Home Value in this Area
Purchase History
| Date | Buyer | Sale Price | Title Company |
|---|---|---|---|
| Hall Corrine K | $130,000 | Attorney | |
| Harrison Shantal N | $145,000 | Residential Title Services | |
| Coleman Josephine | $93,500 | -- |
Source: Public Records
Mortgage History
| Date | Status | Borrower | Loan Amount |
|---|---|---|---|
| Previous Owner | Hall Corrine K | $127,645 | |
| Previous Owner | Harrison Shantal N | $116,000 | |
| Previous Owner | Coleman Josephine | $70,000 |
Source: Public Records
Tax History
| Year | Tax Paid | Tax Assessment Tax Assessment Total Assessment is a certain percentage of the fair market value that is determined by local assessors to be the total taxable value of land and additions on the property. | Land | Improvement |
|---|---|---|---|---|
| 2025 | $6,681 | $17,000 | $2,948 | $14,052 |
| 2024 | $6,681 | $17,000 | $2,948 | $14,052 |
| 2023 | $4,140 | $17,000 | $2,948 | $14,052 |
| 2022 | $4,140 | $11,977 | $2,546 | $9,431 |
| 2021 | $2,416 | $11,977 | $2,546 | $9,431 |
| 2020 | $3,745 | $11,977 | $2,546 | $9,431 |
| 2019 | $2,976 | $10,753 | $2,144 | $8,609 |
| 2018 | $2,905 | $10,753 | $2,144 | $8,609 |
| 2017 | $5,336 | $10,753 | $2,144 | $8,609 |
| 2016 | $4,289 | $8,972 | $2,010 | $6,962 |
| 2015 | $4,132 | $8,972 | $2,010 | $6,962 |
| 2014 | $4,538 | $8,972 | $2,010 | $6,962 |
| 2013 | $4,804 | $10,927 | $2,010 | $8,917 |
Source: Public Records
Map
Nearby Homes
- 327 Marquette Ave
- 1141 Stewart Ave
- 295 Saginaw Ave
- 2605 E Martha Place
- 397 Saginaw Ave
- 1107 Herbert Breclaw Dr
- 14522 S Marquette Ave
- 318 Campbell Ave
- 281 Hoxie Ave
- 1119 Lucas St
- 1060 Lucas St
- 1101 Lucas St
- 383 Calhoun Ave
- 312 Calhoun Ave
- 354 Calhoun Ave
- 2736 E Goodrich Ave
- 288 Calhoun Ave
- 453 Hoxie Ave
- 371 Bensley Ave
- 372 Bensley Ave
- 327 Manistee Ave
- 331 Manistee Ave
- 323 Manistee Ave
- 333 Manistee Ave
- 319 Manistee Ave
- 337 Manistee Ave
- 328 Muskegon Ave
- 326 Muskegon Ave
- 330 Muskegon Ave
- 341 Manistee Ave
- 322 Muskegon Ave
- 332 Muskegon Ave
- 328 Manistee Ave
- 336 Muskegon Ave
- 330 Manistee Ave
- 326 Manistee Ave
- 345 Manistee Ave
- 322 Manistee Ave
- 332 Manistee Ave
Your Personal Tour Guide
Ask me questions while you tour the home.