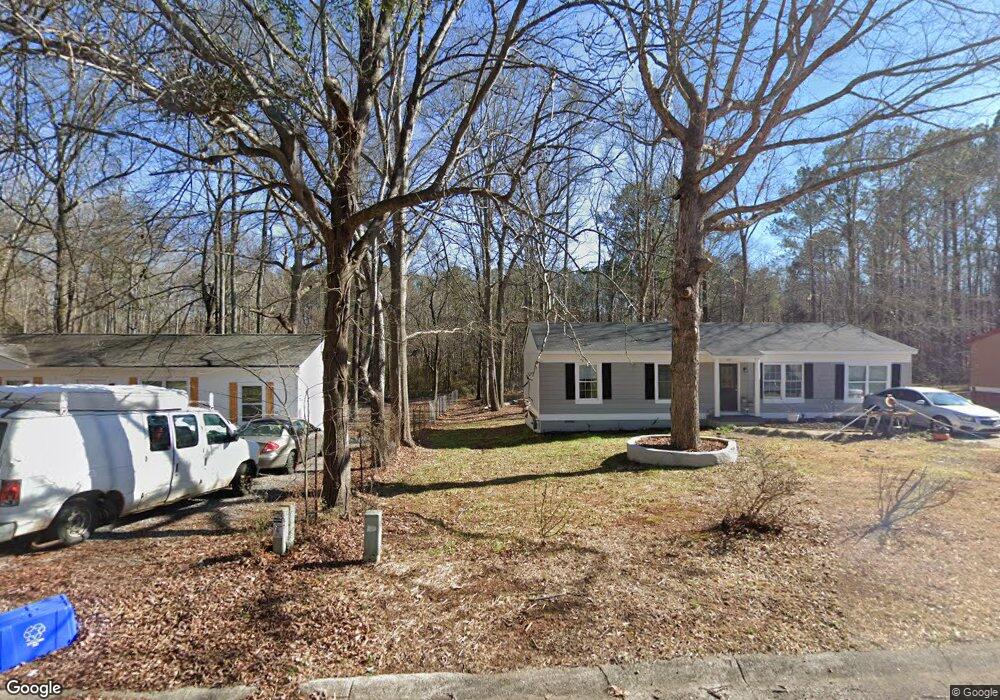
329 Marlborough Downs Rd Bogart, GA 30622
Estimated Value: $244,000 - $288,000
--
Bed
--
Bath
1,300
Sq Ft
$203/Sq Ft
Est. Value
About This Home
This home is located at 329 Marlborough Downs Rd, Bogart, GA 30622 and is currently estimated at $264,010, approximately $203 per square foot. 329 Marlborough Downs Rd is a home located in Clarke County with nearby schools including Cleveland Road Elementary School, Burney-Harris-Lyons Middle School, and Clarke Central High School.
Ownership History
Date
Name
Owned For
Owner Type
Purchase Details
Closed on
May 5, 2023
Sold by
Nalley Ashley
Bought by
Boone Natalie
Current Estimated Value
Home Financials for this Owner
Home Financials are based on the most recent Mortgage that was taken out on this home.
Original Mortgage
$200,000
Outstanding Balance
$193,889
Interest Rate
6.28%
Mortgage Type
New Conventional
Estimated Equity
$70,121
Purchase Details
Closed on
Jan 12, 2023
Sold by
Sorrow Richard Andrew
Bought by
Nalley Ashley and Mceachern Brandon
Purchase Details
Closed on
Oct 31, 2017
Sold by
Sorrow Richard Andrew
Bought by
Sorrow Richard Andrew and Campbell Rebecca Danielle
Home Financials for this Owner
Home Financials are based on the most recent Mortgage that was taken out on this home.
Original Mortgage
$14,979
Interest Rate
3.85%
Mortgage Type
New Conventional
Purchase Details
Closed on
Aug 24, 2017
Sold by
Sorrow Annette Edwards Est
Bought by
Sorrow Richard Andrew
Create a Home Valuation Report for This Property
The Home Valuation Report is an in-depth analysis detailing your home's value as well as a comparison with similar homes in the area
Home Values in the Area
Average Home Value in this Area
Purchase History
| Date | Buyer | Sale Price | Title Company |
|---|---|---|---|
| Boone Natalie | $250,000 | -- | |
| Nalley Ashley | $35,000 | -- | |
| Sorrow Richard Andrew | -- | -- | |
| Sorrow Richard Andrew | $17,426 | -- |
Source: Public Records
Mortgage History
| Date | Status | Borrower | Loan Amount |
|---|---|---|---|
| Open | Boone Natalie | $200,000 | |
| Previous Owner | Sorrow Richard Andrew | $14,979 |
Source: Public Records
Tax History Compared to Growth
Tax History
| Year | Tax Paid | Tax Assessment Tax Assessment Total Assessment is a certain percentage of the fair market value that is determined by local assessors to be the total taxable value of land and additions on the property. | Land | Improvement |
|---|---|---|---|---|
| 2025 | $3,154 | $101,568 | $12,000 | $89,568 |
| 2024 | $3,154 | $93,409 | $12,000 | $81,409 |
| 2023 | $37 | $29,964 | $10,400 | $19,564 |
| 2022 | $509 | $25,963 | $10,400 | $15,563 |
| 2021 | $352 | $20,433 | $5,600 | $14,833 |
| 2020 | $338 | $20,044 | $5,600 | $14,444 |
| 2019 | $652 | $19,212 | $5,600 | $13,612 |
| 2018 | $639 | $18,811 | $4,800 | $14,011 |
| 2017 | $0 | $13,941 | $4,800 | $9,141 |
| 2016 | $103 | $13,025 | $4,800 | $8,225 |
| 2015 | $78 | $12,301 | $4,800 | $7,501 |
| 2014 | $90 | $12,650 | $4,800 | $7,850 |
Source: Public Records
Map
Nearby Homes
- 329 Marlborough Downs Rd
- 345 Marlborough Downs Rd
- 170 Altar Stone Dr
- 170 Altarstone Dr
- 315 Marlborough Downs Rd Unit Lot 5
- 315 Marlborough Downs Rd Unit Lot 24
- 315 Marlborough Downs Rd
- 315 Marlborough Downs Rd
- 315 Marlborough Downs Rd Unit lot 24
- 315 Marlborough Downs Rd
- 355 Marlborough Downs Rd
- 355 Marlborough Downs Rd
- 340 Marlborough Downs Rd
- 165 Altarstone Dr
- 165 Altar Stone Dr
- 350 Marlborough Downs Rd
- 160 Altarstone Dr
- 160 Altar Stone Dr
- 365 Marlborough Downs Rd
- 305 Marlborough Downs Rd