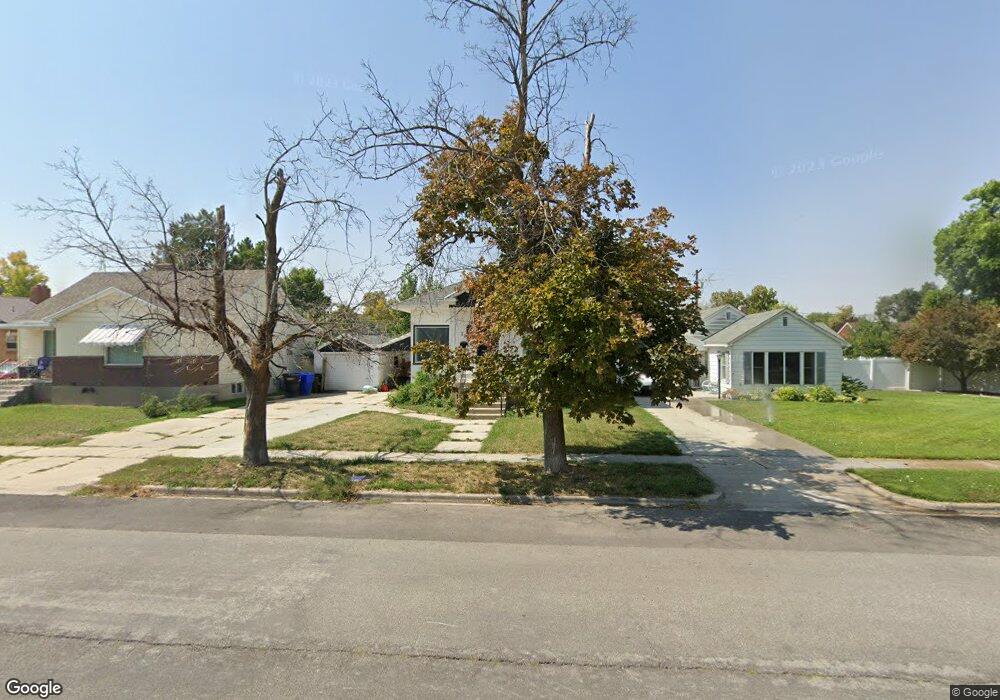
329 N 200 E Tremonton, UT 84337
Estimated Value: $296,000 - $358,000
3
Beds
2
Baths
1,800
Sq Ft
$178/Sq Ft
Est. Value
About This Home
This home is located at 329 N 200 E, Tremonton, UT 84337 and is currently estimated at $319,601, approximately $177 per square foot. 329 N 200 E is a home located in Box Elder County with nearby schools including North Park School, Bear River Middle School, and Alice C. Harris Intermediate School.
Ownership History
Date
Name
Owned For
Owner Type
Purchase Details
Closed on
May 19, 2021
Sold by
Coombs Hayden W and Price Tanika A
Bought by
Wiese Tavin and Wiese Kaelby
Current Estimated Value
Home Financials for this Owner
Home Financials are based on the most recent Mortgage that was taken out on this home.
Original Mortgage
$262,626
Outstanding Balance
$238,005
Interest Rate
3.1%
Mortgage Type
New Conventional
Estimated Equity
$81,596
Purchase Details
Closed on
Apr 2, 2018
Sold by
Cummins Bradon Michael Lee and Cummins Katie
Bought by
Coombs Hayden W and Price Tanika A
Home Financials for this Owner
Home Financials are based on the most recent Mortgage that was taken out on this home.
Original Mortgage
$151,210
Interest Rate
4.4%
Mortgage Type
FHA
Purchase Details
Closed on
Jun 18, 2015
Sold by
Sonerholm Tiffany and Sonerholm Paul A
Bought by
Cummins Brandon Michael Lee
Home Financials for this Owner
Home Financials are based on the most recent Mortgage that was taken out on this home.
Original Mortgage
$110,531
Interest Rate
3.81%
Mortgage Type
VA
Purchase Details
Closed on
Feb 24, 2010
Sold by
Sonerholm Tiffany and Sonerholm Paul A
Bought by
Sonerholm Tiffany and Sonerholm Paul A
Purchase Details
Closed on
Dec 10, 2009
Sold by
Sonerholm Aaron and Sonerholm Tiffany
Bought by
Sonerholm Tiffany and Sonerholm Paul A
Home Financials for this Owner
Home Financials are based on the most recent Mortgage that was taken out on this home.
Original Mortgage
$82,500
Interest Rate
5.01%
Mortgage Type
New Conventional
Purchase Details
Closed on
Oct 8, 2009
Sold by
The Secretary Of Hud
Bought by
Sonerholm Aaron and Sonerholm Tiffany
Home Financials for this Owner
Home Financials are based on the most recent Mortgage that was taken out on this home.
Original Mortgage
$81,900
Interest Rate
5.14%
Mortgage Type
Purchase Money Mortgage
Purchase Details
Closed on
Apr 22, 2008
Sold by
Torres Jose Luis and Torres Maribel
Bought by
Taylor Bean & Whitaker Mortgage Corp
Purchase Details
Closed on
Apr 21, 2008
Sold by
Taylor Bean And Whitaker Mortgage Corp
Bought by
Secretary Of Hud
Purchase Details
Closed on
Jun 22, 2006
Sold by
Cha John and Cha Rachel S
Bought by
Torres Jose Luis and Torres Maribel
Home Financials for this Owner
Home Financials are based on the most recent Mortgage that was taken out on this home.
Original Mortgage
$92,306
Interest Rate
6.7%
Mortgage Type
FHA
Create a Home Valuation Report for This Property
The Home Valuation Report is an in-depth analysis detailing your home's value as well as a comparison with similar homes in the area
Home Values in the Area
Average Home Value in this Area
Purchase History
| Date | Buyer | Sale Price | Title Company |
|---|---|---|---|
| Wiese Tavin | -- | Pinnacle Title | |
| Coombs Hayden W | -- | Stewart Title Insurance Agen | |
| Cummins Brandon Michael Lee | -- | Northern Title Co | |
| Sonerholm Tiffany | -- | -- | |
| Sonerholm Tiffany | -- | -- | |
| Sonerholm Aaron | -- | -- | |
| Taylor Bean & Whitaker Mortgage Corp | -- | -- | |
| Secretary Of Hud | -- | -- | |
| Torres Jose Luis | -- | First American Title Insuran |
Source: Public Records
Mortgage History
| Date | Status | Borrower | Loan Amount |
|---|---|---|---|
| Open | Wiese Tavin | $262,626 | |
| Previous Owner | Coombs Hayden W | $151,210 | |
| Previous Owner | Cummins Brandon Michael Lee | $110,531 | |
| Previous Owner | Sonerholm Tiffany | $82,500 | |
| Previous Owner | Sonerholm Aaron | $81,900 | |
| Previous Owner | Torres Jose Luis | $92,306 | |
| Closed | Taylor Bean & Whitaker Mortgage Corp | -- |
Source: Public Records
Tax History Compared to Growth
Tax History
| Year | Tax Paid | Tax Assessment Tax Assessment Total Assessment is a certain percentage of the fair market value that is determined by local assessors to be the total taxable value of land and additions on the property. | Land | Improvement |
|---|---|---|---|---|
| 2025 | $1,684 | $292,637 | $105,000 | $187,637 |
| 2024 | $1,684 | $291,569 | $105,000 | $186,569 |
| 2023 | $1,712 | $291,054 | $100,000 | $191,054 |
| 2022 | $1,487 | $144,180 | $16,500 | $127,680 |
| 2021 | $1,159 | $152,082 | $30,000 | $122,082 |
| 2020 | $987 | $152,082 | $30,000 | $122,082 |
| 2019 | $924 | $75,920 | $16,500 | $59,420 |
| 2018 | $778 | $58,393 | $13,750 | $44,643 |
| 2017 | $804 | $106,169 | $13,750 | $81,169 |
| 2016 | $793 | $56,267 | $13,750 | $42,517 |
| 2015 | $728 | $52,402 | $13,750 | $38,652 |
| 2014 | $728 | $50,562 | $13,750 | $36,812 |
| 2013 | -- | $50,150 | $13,338 | $36,812 |
Source: Public Records
Map
Nearby Homes
- 155 E 300 N
- 524 N 100 E
- 137 N 870 E
- 225 E 600 N
- 3 W 600 N
- 720 N 300 E
- 476 W 450 N
- 780 N 350 E
- 635 E 240 N Unit 9
- 635 E 240 N
- 789 N 100 W
- 221 E 800 N
- 758 N 400 E
- 518 E 40 S
- 144 S 100 W
- 1286 E 240 N Unit 15
- 236 S Tremont St
- Auburn Plan at River's Edge - Tremonton
- Aberdeen Plan at River's Edge - Tremonton
- Glendale Plan at River's Edge - Tremonton