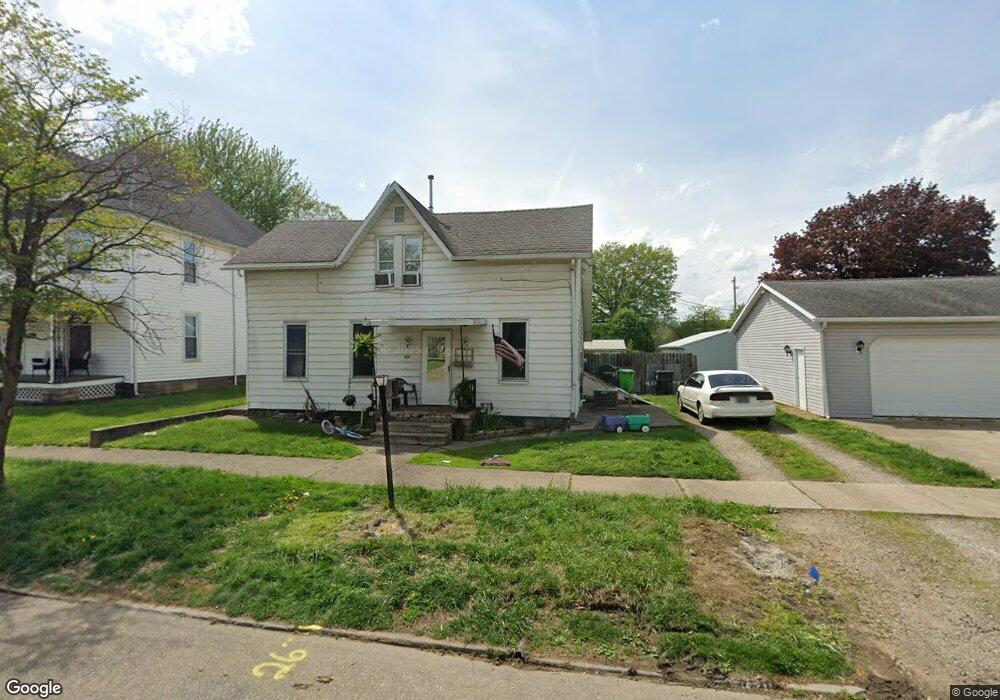
329 N 4th St Coshocton, OH 43812
Estimated Value: $122,406 - $174,000
4
Beds
1
Bath
1,504
Sq Ft
$91/Sq Ft
Est. Value
About This Home
This home is located at 329 N 4th St, Coshocton, OH 43812 and is currently estimated at $137,102, approximately $91 per square foot. 329 N 4th St is a home located in Coshocton County with nearby schools including Coshocton High School, Coshocton Opportunity School, and Sacred Heart School.
Ownership History
Date
Name
Owned For
Owner Type
Purchase Details
Closed on
Jul 31, 2008
Sold by
Poole Homer D
Bought by
Poole John A and Poole Krystle D
Current Estimated Value
Home Financials for this Owner
Home Financials are based on the most recent Mortgage that was taken out on this home.
Original Mortgage
$62,549
Outstanding Balance
$41,173
Interest Rate
6.39%
Mortgage Type
FHA
Estimated Equity
$95,929
Purchase Details
Closed on
Aug 18, 2004
Sold by
Elson John W
Bought by
Poole Homer D
Purchase Details
Closed on
Jan 6, 2003
Sold by
Elson Ethel
Bought by
Elson John W
Create a Home Valuation Report for This Property
The Home Valuation Report is an in-depth analysis detailing your home's value as well as a comparison with similar homes in the area
Home Values in the Area
Average Home Value in this Area
Purchase History
| Date | Buyer | Sale Price | Title Company |
|---|---|---|---|
| Poole John A | $72,500 | None Available | |
| Poole Homer D | $52,000 | -- | |
| Elson John W | -- | -- |
Source: Public Records
Mortgage History
| Date | Status | Borrower | Loan Amount |
|---|---|---|---|
| Open | Poole John A | $62,549 |
Source: Public Records
Tax History Compared to Growth
Tax History
| Year | Tax Paid | Tax Assessment Tax Assessment Total Assessment is a certain percentage of the fair market value that is determined by local assessors to be the total taxable value of land and additions on the property. | Land | Improvement |
|---|---|---|---|---|
| 2024 | $888 | $21,490 | $4,720 | $16,770 |
| 2023 | $888 | $16,891 | $3,633 | $13,258 |
| 2022 | $807 | $16,891 | $3,633 | $13,258 |
| 2021 | $809 | $16,891 | $3,633 | $13,258 |
| 2020 | $969 | $19,632 | $3,539 | $16,093 |
| 2019 | $981 | $19,632 | $3,539 | $16,093 |
| 2018 | $963 | $19,632 | $3,539 | $16,093 |
| 2017 | $975 | $18,970 | $3,304 | $15,666 |
| 2016 | $935 | $18,970 | $3,304 | $15,666 |
| 2015 | $470 | $18,970 | $3,304 | $15,666 |
| 2014 | $822 | $17,871 | $4,403 | $13,468 |
Source: Public Records
Map
Nearby Homes