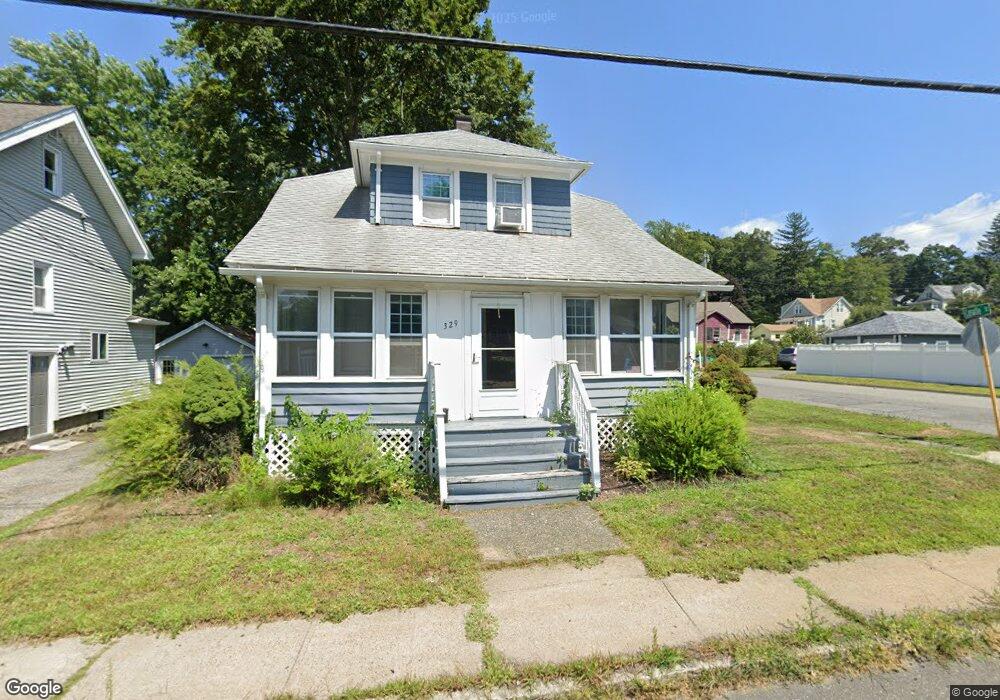
329 N Main St East Longmeadow, MA 01028
Estimated Value: $302,000 - $344,000
3
Beds
2
Baths
1,326
Sq Ft
$244/Sq Ft
Est. Value
About This Home
This home is located at 329 N Main St, East Longmeadow, MA 01028 and is currently estimated at $323,016, approximately $243 per square foot. 329 N Main St is a home located in Hampden County with nearby schools including Meadowbrook Elementary School, Birchland Park Middle School, and East Longmeadow High School.
Ownership History
Date
Name
Owned For
Owner Type
Purchase Details
Closed on
Dec 20, 2024
Sold by
Bellucci Gary P
Bought by
Gary Paul Bellucci Irt and Bellucci
Current Estimated Value
Purchase Details
Closed on
Jun 21, 1988
Sold by
Bellucci Gary P
Bought by
Bellucci Gary P
Home Financials for this Owner
Home Financials are based on the most recent Mortgage that was taken out on this home.
Original Mortgage
$40,000
Interest Rate
10.24%
Mortgage Type
Purchase Money Mortgage
Purchase Details
Closed on
Sep 23, 1987
Sold by
Jacobson Gena
Bought by
Bellucci Gary P
Home Financials for this Owner
Home Financials are based on the most recent Mortgage that was taken out on this home.
Original Mortgage
$65,000
Interest Rate
10.37%
Mortgage Type
Purchase Money Mortgage
Create a Home Valuation Report for This Property
The Home Valuation Report is an in-depth analysis detailing your home's value as well as a comparison with similar homes in the area
Home Values in the Area
Average Home Value in this Area
Purchase History
| Date | Buyer | Sale Price | Title Company |
|---|---|---|---|
| Gary Paul Bellucci Irt | -- | None Available | |
| Gary Paul Bellucci Irt | -- | None Available | |
| Bellucci Gary P | $130,000 | -- | |
| Bellucci Gary P | $98,500 | -- |
Source: Public Records
Mortgage History
| Date | Status | Borrower | Loan Amount |
|---|---|---|---|
| Previous Owner | Bellucci Gary P | $15,830 | |
| Previous Owner | Bellucci Gary P | $40,000 | |
| Previous Owner | Bellucci Gary P | $65,000 |
Source: Public Records
Tax History Compared to Growth
Tax History
| Year | Tax Paid | Tax Assessment Tax Assessment Total Assessment is a certain percentage of the fair market value that is determined by local assessors to be the total taxable value of land and additions on the property. | Land | Improvement |
|---|---|---|---|---|
| 2025 | $4,171 | $225,700 | $98,200 | $127,500 |
| 2024 | $4,006 | $216,100 | $98,200 | $117,900 |
| 2023 | $3,782 | $197,000 | $89,300 | $107,700 |
| 2022 | $3,575 | $176,200 | $81,100 | $95,100 |
| 2021 | $3,506 | $166,500 | $75,100 | $91,400 |
| 2020 | $3,372 | $161,800 | $75,100 | $86,700 |
| 2019 | $3,241 | $157,700 | $72,900 | $84,800 |
| 2018 | $3,639 | $173,800 | $72,900 | $100,900 |
| 2017 | $3,506 | $168,800 | $71,200 | $97,600 |
| 2016 | $3,497 | $165,600 | $69,200 | $96,400 |
| 2015 | $3,431 | $165,600 | $69,200 | $96,400 |
Source: Public Records
Map
Nearby Homes