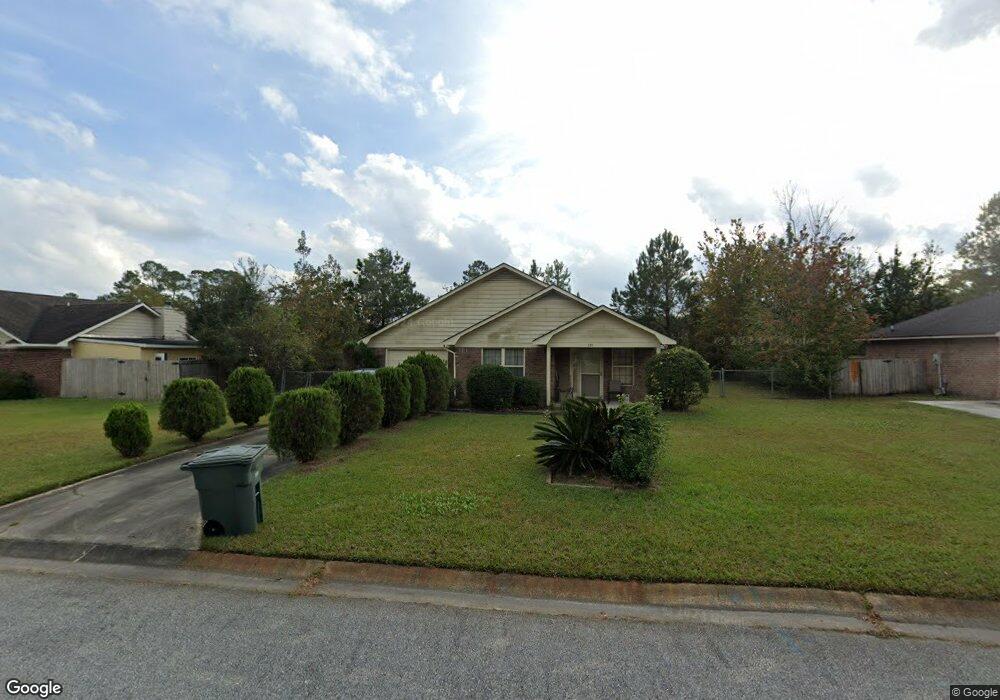
329 Nottingham Way Hinesville, GA 31313
Estimated Value: $196,000 - $220,706
3
Beds
2
Baths
1,456
Sq Ft
$147/Sq Ft
Est. Value
About This Home
This home is located at 329 Nottingham Way, Hinesville, GA 31313 and is currently estimated at $213,427, approximately $146 per square foot. 329 Nottingham Way is a home located in Liberty County with nearby schools including Frank Long Elementary School, Lewis Frasier Middle School, and Liberty County High School.
Ownership History
Date
Name
Owned For
Owner Type
Purchase Details
Closed on
Apr 29, 2016
Sold by
Sec Of Veterans Affa
Bought by
Cannady Delores
Current Estimated Value
Home Financials for this Owner
Home Financials are based on the most recent Mortgage that was taken out on this home.
Original Mortgage
$70,049
Outstanding Balance
$56,142
Interest Rate
3.87%
Mortgage Type
FHA
Estimated Equity
$157,285
Purchase Details
Closed on
Oct 6, 2015
Sold by
Wells Fargo Bank
Bought by
Sec Of Veterans Affairs
Purchase Details
Closed on
Aug 26, 2010
Sold by
Leonty George L
Bought by
Dozier Tiffani D
Home Financials for this Owner
Home Financials are based on the most recent Mortgage that was taken out on this home.
Original Mortgage
$124,112
Interest Rate
4.6%
Mortgage Type
VA
Purchase Details
Closed on
Dec 1, 1994
Bought by
Leonty George L
Create a Home Valuation Report for This Property
The Home Valuation Report is an in-depth analysis detailing your home's value as well as a comparison with similar homes in the area
Home Values in the Area
Average Home Value in this Area
Purchase History
| Date | Buyer | Sale Price | Title Company |
|---|---|---|---|
| Cannady Delores | $71,343 | -- | |
| Sec Of Veterans Affairs | $76,545 | -- | |
| Wells Fargo Bank | -- | -- | |
| Dozier Tiffani D | $121,500 | -- | |
| Leonty George L | $74,700 | -- |
Source: Public Records
Mortgage History
| Date | Status | Borrower | Loan Amount |
|---|---|---|---|
| Open | Cannady Delores | $70,049 | |
| Previous Owner | Dozier Tiffani D | $124,112 |
Source: Public Records
Tax History Compared to Growth
Tax History
| Year | Tax Paid | Tax Assessment Tax Assessment Total Assessment is a certain percentage of the fair market value that is determined by local assessors to be the total taxable value of land and additions on the property. | Land | Improvement |
|---|---|---|---|---|
| 2024 | $2,033 | $71,794 | $12,000 | $59,794 |
| 2023 | $2,033 | $67,196 | $12,000 | $55,196 |
| 2022 | $1,729 | $50,379 | $10,000 | $40,379 |
| 2021 | $1,598 | $45,830 | $10,000 | $35,830 |
| 2020 | $1,398 | $41,346 | $10,000 | $31,346 |
| 2019 | $1,407 | $41,747 | $10,000 | $31,747 |
| 2018 | $1,422 | $42,149 | $10,000 | $32,149 |
| 2017 | $1,401 | $42,551 | $10,000 | $32,551 |
| 2016 | $1,939 | $42,953 | $10,000 | $32,953 |
| 2015 | $2,087 | $42,953 | $10,000 | $32,953 |
| 2014 | $2,087 | $45,764 | $9,200 | $36,564 |
| 2013 | -- | $46,278 | $9,200 | $37,078 |
Source: Public Records
Map
Nearby Homes
- 332 Mortar Place
- 806 Hod Ln
- 810 Hod Ln
- 706 Dover Ln
- 718 Dover Ln
- 314 York Ln
- 718 Dove Ln
- 330 Wexford Dr
- 1316 Hill View Cir
- 1232 Peacock Trail
- 76 Boundary Hal Way
- 818 W Oglethorpe Hwy
- 408 Flowers Dr
- 411 Christopher Dr
- 614 S Main St
- 1109 Sara Ln
- 14.27+/- Oglethorpe Hwy
- 0 U S 84
- 412 Timberlane Cir
- 832 W Oglethorpe Hwy
- 353 Nottingham Way
- 327 Nottingham Way
- 823 Kiln Ln
- 825 Kiln Ln
- 821 Kiln Ln
- 332 Nottingham Way
- 827 Kiln Ln
- 331 Mortar Place
- 334 Nottingham Way
- 325 Nottingham Way
- 831 N Brickyard Rd
- 833 N Brickyard Rd
- 829 Kiln Ln
- 833 Brickyard Rd
- 831 Brickyard Rd
- 822 Kiln Ln
- 834 Brickyard Rd
- 824 Kiln Ln
- 333 Mortar Place
- 820 Kiln Ln