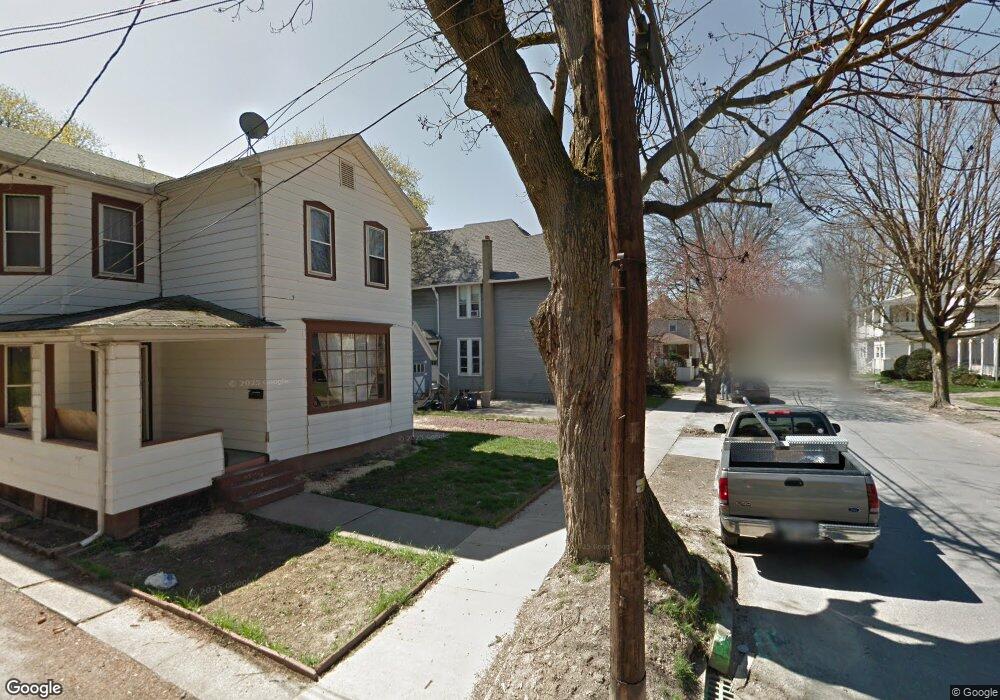
329 Race St West Pittston, PA 18643
Estimated Value: $139,000 - $195,000
3
Beds
2
Baths
1,427
Sq Ft
$114/Sq Ft
Est. Value
About This Home
This home is located at 329 Race St, West Pittston, PA 18643 and is currently estimated at $162,592, approximately $113 per square foot. 329 Race St is a home located in Luzerne County with nearby schools including Wyoming Area Secondary Center and Wyoming Area Catholic School.
Ownership History
Date
Name
Owned For
Owner Type
Purchase Details
Closed on
Jan 10, 2018
Sold by
Lucky 3 Rei Llc
Bought by
Sperrazza James and Sperrazza Renee
Current Estimated Value
Purchase Details
Closed on
Nov 13, 2015
Sold by
Gilpin Stephen J and Stephen Gilpin & Associates In
Bought by
Lucky 3 Rei Llc
Purchase Details
Closed on
Mar 20, 2015
Sold by
Gnudi Gabriele and Gnudi Bernadette
Bought by
Stephen Gilpin & Associates
Purchase Details
Closed on
Nov 18, 1986
Bought by
Gnudi Gabriele and Gnudi Bernadette K
Create a Home Valuation Report for This Property
The Home Valuation Report is an in-depth analysis detailing your home's value as well as a comparison with similar homes in the area
Home Values in the Area
Average Home Value in this Area
Purchase History
| Date | Buyer | Sale Price | Title Company |
|---|---|---|---|
| Sperrazza James | $15,000 | None Available | |
| Lucky 3 Rei Limited Liability Company | -- | None Available | |
| Lucky 3 Rei Llc | $2,888 | None Available | |
| Stephen Gilpin & Associates | $21,800 | None Available | |
| Gnudi Gabriele | -- | -- |
Source: Public Records
Tax History Compared to Growth
Tax History
| Year | Tax Paid | Tax Assessment Tax Assessment Total Assessment is a certain percentage of the fair market value that is determined by local assessors to be the total taxable value of land and additions on the property. | Land | Improvement |
|---|---|---|---|---|
| 2025 | $2,248 | $70,900 | $16,500 | $54,400 |
| 2024 | $2,157 | $70,900 | $16,500 | $54,400 |
| 2023 | $2,025 | $70,900 | $16,500 | $54,400 |
| 2022 | $2,012 | $70,900 | $16,500 | $54,400 |
| 2021 | $1,987 | $70,900 | $16,500 | $54,400 |
| 2020 | $1,926 | $70,900 | $16,500 | $54,400 |
| 2019 | $1,876 | $70,900 | $16,500 | $54,400 |
| 2018 | $1,799 | $70,900 | $16,500 | $54,400 |
| 2017 | $1,762 | $70,900 | $16,500 | $54,400 |
| 2016 | -- | $70,900 | $16,500 | $54,400 |
| 2015 | $1,267 | $70,900 | $16,500 | $54,400 |
| 2014 | $1,267 | $70,900 | $16,500 | $54,400 |
Source: Public Records
Map
Nearby Homes
- 325 A & B Race St
- 16 Montgomery Ave
- 20 Montgomery Ave
- 18 Montgomery Ave
- 325 A & B Race St
- 325 Race St
- 346 Race St
- 11 Bond St
- 12 Montgomery Ave
- 340 Race St
- 344 Race St
- 321 Race St
- 24 Montgomery Ave
- 336 Race St
- 334 Race St
- 17 Montgomery Ave
- 11 Montgomery Ave
- 319 Race St
- 15 Montgomery Ave
- 26 Montgomery Ave