329 S Main St Randolph, MA 02368
South Randolph NeighborhoodEstimated Value: $449,000 - $476,000
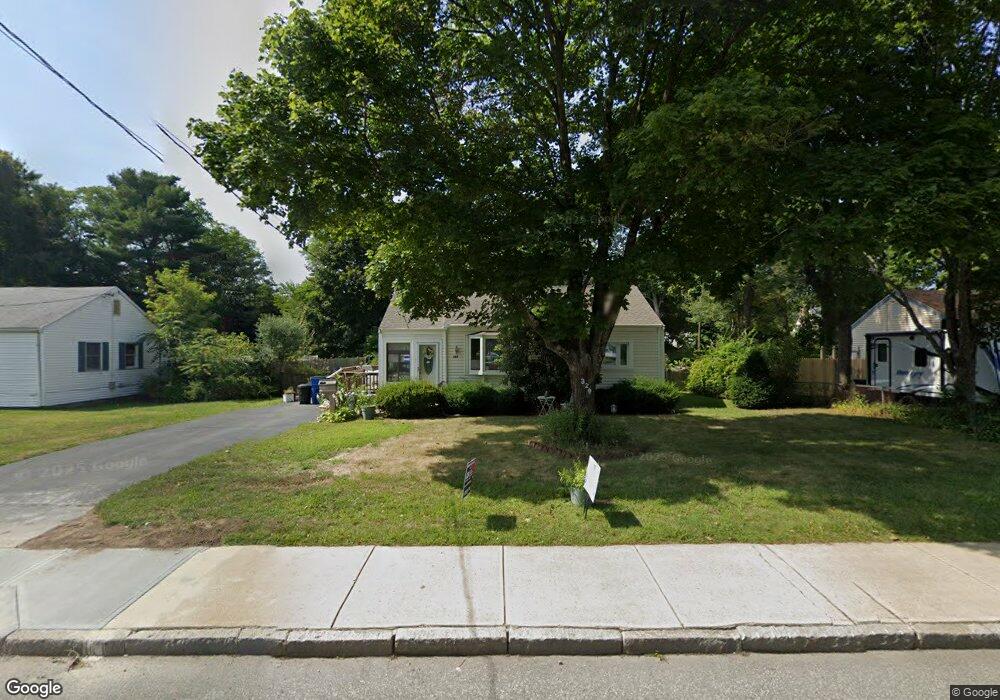
About This Home
This home is located at 329 S Main St, Randolph, MA 02368 and is currently estimated at $464,308, approximately $580 per square foot. 329 S Main St is a home located in Norfolk County with nearby schools including Randolph High School and Lighthouse Baptist Christian Academy.
Ownership History
We collect this data history from publicly available records. To have your information removed, we recommend requesting removal directly through your county’s website.
Purchase Details
Home Financials for this Owner
Home Financials are based on the most recent Mortgage that was taken out on this home.Home Values in the Area
Average Home Value in this Area
Purchase History
We collect this data history from publicly available records. To have your information removed, we recommend requesting removal directly through your county’s website.
| Date | Buyer | Sale Price | Title Company |
|---|---|---|---|
| $260,000 | -- |
Mortgage History
We collect this data history from publicly available records. To have your information removed, we recommend requesting removal directly through your county’s website.
| Date | Status | Borrower | Loan Amount |
|---|---|---|---|
| Open | $180,000 |
Tax History
We collect this data history from publicly available records. To have your information removed, we recommend requesting removal directly through your county’s website.
| Year | Tax Paid | Tax Assessment Tax Assessment Total Assessment is a certain percentage of the fair market value that is determined by local assessors to be the total taxable value of land and additions on the property. | Land | Improvement |
|---|---|---|---|---|
| 2025 | $4,751 | $409,200 | $228,400 | $180,800 |
| 2024 | $4,449 | $388,600 | $223,900 | $164,700 |
| 2023 | $4,400 | $364,200 | $203,500 | $160,700 |
| 2022 | $4,162 | $306,000 | $169,600 | $136,400 |
| 2021 | $4,013 | $271,500 | $141,300 | $130,200 |
| 2020 | $4,036 | $270,700 | $141,300 | $129,400 |
| 2019 | $3,871 | $258,400 | $134,600 | $123,800 |
| 2018 | $3,589 | $226,000 | $122,400 | $103,600 |
| 2017 | $3,382 | $209,000 | $116,600 | $92,400 |
| 2016 | $3,295 | $189,500 | $106,000 | $83,500 |
| 2015 | $3,274 | $180,900 | $100,900 | $80,000 |
Map
- 301 Highland Ave
- 20 Fairmount St
- 8 Stevens Terrace
- 24 Toscano Way Unit 24
- 18 Toscano Way Unit 18
- 20 Toscano Way Unit 20
- 10 Toscano Way Unit 10
- 65 Tiffany Dr
- 20 Millhouse Ave
- 117 S Main St
- 189 South St
- 143 South St
- 71 Cole Terrace
- 10 N Glenway Ave
- 20 Madison Ave
- 25 Gloversbrook Rd
- 153 Union St
- 158 Union St
- 38 Druid Hill Ave E
- 6 Sunnyside Ave
Ask me questions while you tour the home.