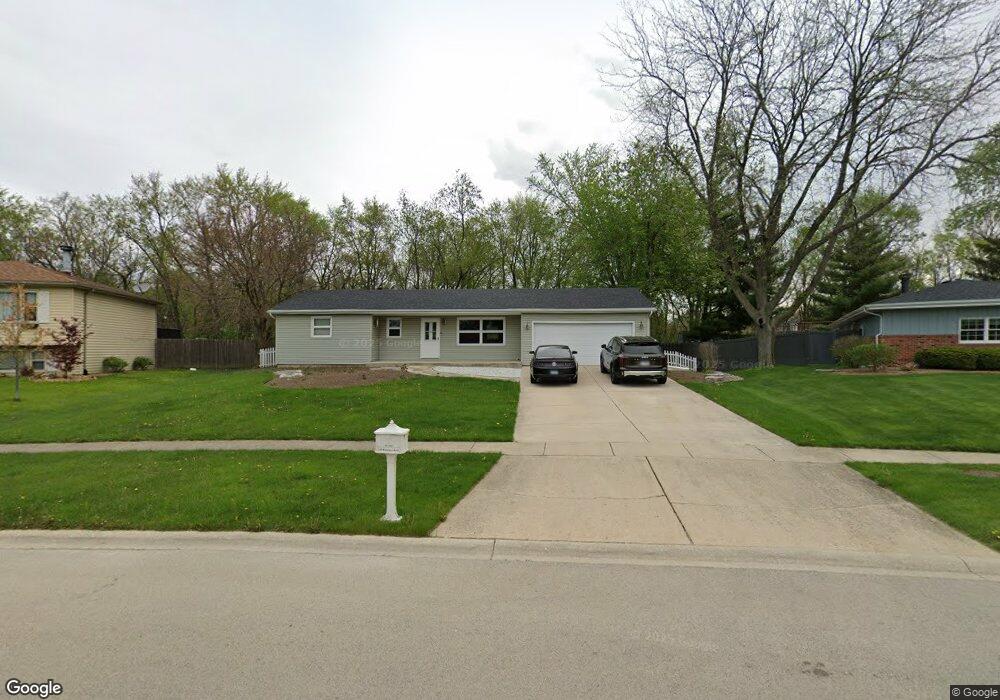
329 Stonegate Rd New Lenox, IL 60451
Estimated Value: $362,000 - $363,000
4
Beds
2
Baths
--
Sq Ft
7,405
Sq Ft Lot
About This Home
This home is located at 329 Stonegate Rd, New Lenox, IL 60451 and is currently estimated at $362,500. 329 Stonegate Rd is a home located in Will County with nearby schools including Bentley Elementary School, Arnold J Tyler School, and Alex M Martino Jr High School.
Ownership History
Date
Name
Owned For
Owner Type
Purchase Details
Closed on
Aug 22, 2006
Sold by
Danzinger Michael and Danzinger Sharon Y
Bought by
Danzinger Sharon Y
Current Estimated Value
Purchase Details
Closed on
Nov 30, 2005
Sold by
Stonegate Village Llc
Bought by
Heeley Jason L and Heeley Carol L
Purchase Details
Closed on
Mar 26, 2004
Sold by
Madden James E
Bought by
Danzinger Michael and Danzinger Sharon Y
Home Financials for this Owner
Home Financials are based on the most recent Mortgage that was taken out on this home.
Original Mortgage
$110,000
Interest Rate
5.65%
Mortgage Type
Purchase Money Mortgage
Purchase Details
Closed on
Mar 23, 2004
Sold by
Madden Patricia
Bought by
Madden James E
Home Financials for this Owner
Home Financials are based on the most recent Mortgage that was taken out on this home.
Original Mortgage
$110,000
Interest Rate
5.65%
Mortgage Type
Purchase Money Mortgage
Create a Home Valuation Report for This Property
The Home Valuation Report is an in-depth analysis detailing your home's value as well as a comparison with similar homes in the area
Home Values in the Area
Average Home Value in this Area
Purchase History
| Date | Buyer | Sale Price | Title Company |
|---|---|---|---|
| Danzinger Sharon Y | -- | None Available | |
| Heeley Jason L | $339,500 | First American Title Ins Co | |
| Danzinger Michael | $180,000 | Chicago Title Insurance Co | |
| Madden James E | -- | Chicago Title Insurance Co |
Source: Public Records
Mortgage History
| Date | Status | Borrower | Loan Amount |
|---|---|---|---|
| Previous Owner | Danzinger Michael | $110,000 |
Source: Public Records
Tax History
| Year | Tax Paid | Tax Assessment Tax Assessment Total Assessment is a certain percentage of the fair market value that is determined by local assessors to be the total taxable value of land and additions on the property. | Land | Improvement |
|---|---|---|---|---|
| 2024 | $7,140 | $87,979 | $33,360 | $54,619 |
| 2023 | $7,140 | $80,199 | $30,410 | $49,789 |
| 2022 | $6,393 | $73,882 | $28,015 | $45,867 |
| 2021 | $6,090 | $69,483 | $26,347 | $43,136 |
| 2020 | $5,398 | $67,004 | $25,407 | $41,597 |
| 2019 | $4,526 | $64,926 | $24,619 | $40,307 |
| 2018 | $4,590 | $62,687 | $23,770 | $38,917 |
| 2017 | $4,342 | $60,885 | $23,087 | $37,798 |
| 2016 | $4,197 | $59,255 | $22,469 | $36,786 |
| 2015 | $4,033 | $57,390 | $21,762 | $35,628 |
| 2014 | $4,033 | $56,681 | $21,493 | $35,188 |
| 2013 | $4,033 | $57,445 | $21,783 | $35,662 |
Source: Public Records
Map
Nearby Homes
- 318 William St
- 289 Osage Ln
- 1787 Lakes Park Dr
- 3126 Timberlake Ave
- 1777 Lakes Park Dr
- 2970 Timberlake Ave
- 3000 Timberlake Ave
- 3003 Timberlake Ave
- 2930 Amaranth Ct
- 270 Osage Ln
- 3024 Timberlake Ave
- 1771 Lakes Park Dr
- 250 Teerling Cir
- 1801 Lakes Park Dr
- 2951 Amaranth Ct
- 2920 Amaranth Ct
- 3174 Waterwood Ln
- 1717 Lakes Park Dr
- 2940 Amaranth Ct
- 295 Osage Ln
- 325 Stonegate Rd
- 331 Stonegate Rd
- 600 Stonegate Rd
- 321 Stonegate Rd
- 336 E Joliet Hwy
- 320 Stonegate Rd
- 601 Stonegate Rd
- 604 Stonegate Rd
- 317 Stonegate Rd
- 605 S Cooper Rd
- 600 Southgate Rd
- 340 E Joliet Hwy
- 605 Stonegate Rd
- 313 Stonegate Rd
- 604 Southgate Rd
- 608 Stonegate Rd
- 609 S Cooper Rd
- 608 Southgate Rd
- 613 S Cooper Rd
- 309 Stonegate Rd
Your Personal Tour Guide
Ask me questions while you tour the home.