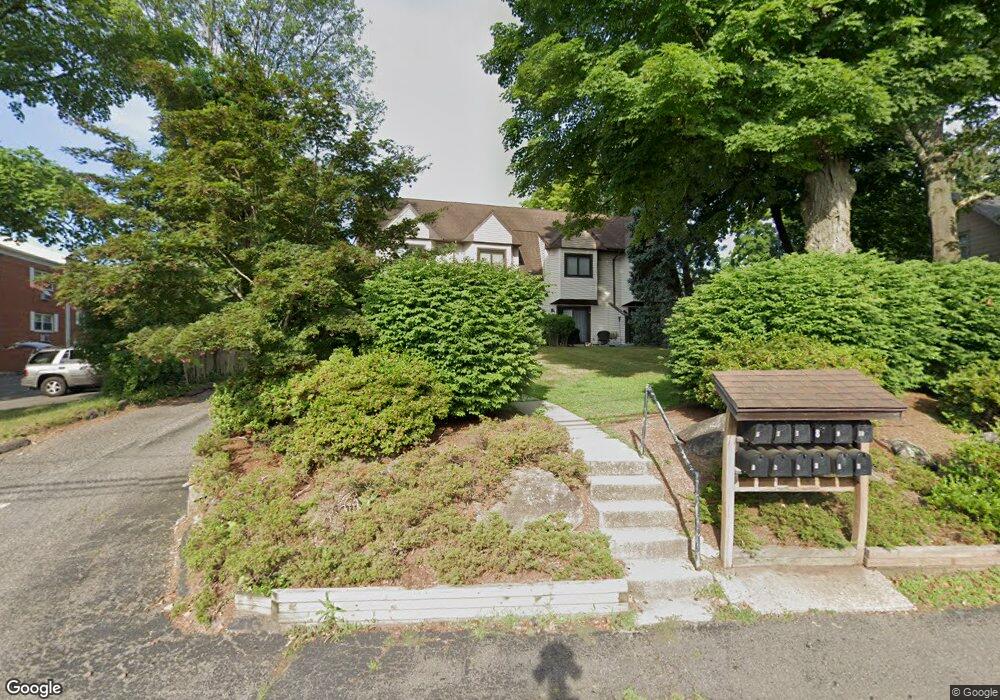
329 Strawberry Hill Ave Unit 7 Norwalk, CT 06851
Wolfpit NeighborhoodEstimated Value: $416,000 - $433,000
2
Beds
2
Baths
1,170
Sq Ft
$362/Sq Ft
Est. Value
About This Home
This home is located at 329 Strawberry Hill Ave Unit 7, Norwalk, CT 06851 and is currently estimated at $423,820, approximately $362 per square foot. 329 Strawberry Hill Ave Unit 7 is a home located in Fairfield County with nearby schools including Wolfpit School, Nathan Hale Middle School, and Norwalk High School.
Ownership History
Date
Name
Owned For
Owner Type
Purchase Details
Closed on
Dec 18, 1998
Sold by
Rogers James D and Rogers Elizabeth
Bought by
Pepin Nancy D
Current Estimated Value
Home Financials for this Owner
Home Financials are based on the most recent Mortgage that was taken out on this home.
Original Mortgage
$40,000
Outstanding Balance
$11,272
Interest Rate
6.85%
Estimated Equity
$412,548
Purchase Details
Closed on
Apr 19, 1996
Sold by
Nathan Alan L
Bought by
Rogers James and Rogers Elizabeth
Home Financials for this Owner
Home Financials are based on the most recent Mortgage that was taken out on this home.
Original Mortgage
$106,875
Interest Rate
7.34%
Mortgage Type
Unknown
Purchase Details
Closed on
May 23, 1991
Sold by
Little Gary
Bought by
Nathan Alan
Create a Home Valuation Report for This Property
The Home Valuation Report is an in-depth analysis detailing your home's value as well as a comparison with similar homes in the area
Home Values in the Area
Average Home Value in this Area
Purchase History
| Date | Buyer | Sale Price | Title Company |
|---|---|---|---|
| Pepin Nancy D | $125,000 | -- | |
| Pepin Nancy D | $125,000 | -- | |
| Rogers James | $114,500 | -- | |
| Rogers James | $114,500 | -- | |
| Nathan Alan | $125,000 | -- |
Source: Public Records
Mortgage History
| Date | Status | Borrower | Loan Amount |
|---|---|---|---|
| Open | Nathan Alan | $40,000 | |
| Closed | Nathan Alan | $40,000 | |
| Previous Owner | Nathan Alan | $106,875 |
Source: Public Records
Tax History Compared to Growth
Tax History
| Year | Tax Paid | Tax Assessment Tax Assessment Total Assessment is a certain percentage of the fair market value that is determined by local assessors to be the total taxable value of land and additions on the property. | Land | Improvement |
|---|---|---|---|---|
| 2025 | $5,261 | $221,630 | $0 | $221,630 |
| 2024 | $5,181 | $221,630 | $0 | $221,630 |
| 2023 | $4,050 | $162,240 | $0 | $162,240 |
| 2022 | $3,987 | $162,240 | $0 | $162,240 |
| 2021 | $3,392 | $162,240 | $0 | $162,240 |
| 2020 | $3,830 | $162,240 | $0 | $162,240 |
| 2019 | $3,781 | $162,240 | $0 | $162,240 |
| 2018 | $3,756 | $144,870 | $0 | $144,870 |
| 2017 | $3,625 | $144,870 | $0 | $144,870 |
| 2016 | $3,685 | $144,870 | $0 | $144,870 |
| 2015 | $3,310 | $144,870 | $0 | $144,870 |
| 2014 | $3,628 | $144,870 | $0 | $144,870 |
Source: Public Records
Map
Nearby Homes
- 341 Strawberry Hill Ave
- 65 Wolfpit Ave Unit 5C
- 360 Westport Ave Unit 1
- 11 Mark Dr
- 100 Wolfpit Ave Unit 2
- 100 Wolfpit Ave Unit 17
- 42 County St
- 38 Saddle Rd
- 80 County St Unit 9K
- 80 County St Unit 3A
- 80 County St Unit 2Q
- 80 County St Unit 11K
- 33 Assisi Way
- 71 Saddle Rd
- 505 Westport Ave
- 142 Wolfpit Ave
- 30 Honeysuckle Dr
- 17 Oriole Dr
- 44 King St
- 15 Renzulli Rd
- 329 Strawberry Hill Ave Unit 9
- 329 Strawberry Hill Ave Unit 8
- 329 Strawberry Hill Ave Unit 6
- 329 Strawberry Hill Ave Unit 5
- 329 Strawberry Hill Ave Unit 10
- 329 Strawberry Hill Ave Unit 4
- 329 Strawberry Hill Ave Unit 2
- 329 Strawberry Hill Ave Unit 1
- 323 Strawberry Hill Ave
- 333 Strawberry Hill Ave
- 319 Strawberry Hill Ave
- 324 Strawberry Hill Ave Unit B209
- 324 Strawberry Hill Ave Unit B208
- 324 Strawberry Hill Ave Unit B207
- 324 Strawberry Hill Ave Unit B206
- 324 Strawberry Hill Ave Unit B205
- 324 Strawberry Hill Ave Unit B204
- 324 Strawberry Hill Ave Unit B203
- 324 Strawberry Hill Ave Unit B202
- 324 Strawberry Hill Ave Unit B201