Estimated Value: $67,000 - $116,000
1
Bed
1
Bath
672
Sq Ft
$137/Sq Ft
Est. Value
About This Home
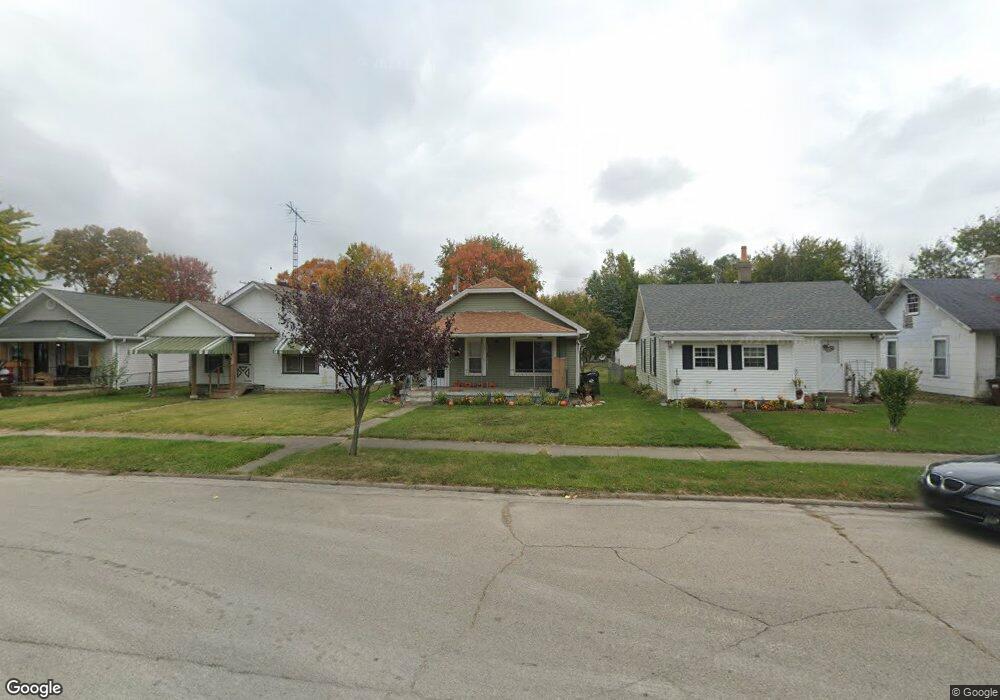
This home is located at 329 Walnut St, Xenia, OH 45385 and is currently estimated at $91,841, approximately $136 per square foot. 329 Walnut St is a home located in Greene County with nearby schools including Xenia High School, Summit Academy Community School for Alternative Learners - Xenia, and Legacy Christian Academy.
Ownership History
Date
Name
Owned For
Owner Type
Purchase Details
Closed on
Feb 15, 2022
Sold by
Miller Marc D and Miller Diane M
Bought by
Dmm Real Estate Properties Llc
Current Estimated Value
Purchase Details
Closed on
Aug 27, 2002
Sold by
Minshall Bertha M
Bought by
Miller Marc D and Miller Diane M
Home Financials for this Owner
Home Financials are based on the most recent Mortgage that was taken out on this home.
Original Mortgage
$30,190
Interest Rate
6.56%
Create a Home Valuation Report for This Property
The Home Valuation Report is an in-depth analysis detailing your home's value as well as a comparison with similar homes in the area
Home Values in the Area
Average Home Value in this Area
Purchase History
| Date | Buyer | Sale Price | Title Company |
|---|---|---|---|
| Dmm Real Estate Properties Llc | -- | Becker & Lilly Llc | |
| Miller Marc D | $43,000 | -- |
Source: Public Records
Mortgage History
| Date | Status | Borrower | Loan Amount |
|---|---|---|---|
| Previous Owner | Miller Marc D | $30,190 |
Source: Public Records
Tax History Compared to Growth
Tax History
| Year | Tax Paid | Tax Assessment Tax Assessment Total Assessment is a certain percentage of the fair market value that is determined by local assessors to be the total taxable value of land and additions on the property. | Land | Improvement |
|---|---|---|---|---|
| 2024 | $935 | $21,860 | $4,490 | $17,370 |
| 2023 | $935 | $21,860 | $4,490 | $17,370 |
| 2022 | $840 | $16,740 | $3,600 | $13,140 |
| 2021 | $851 | $16,740 | $3,600 | $13,140 |
| 2020 | $713 | $16,740 | $3,600 | $13,140 |
| 2019 | $713 | $13,780 | $3,230 | $10,550 |
| 2018 | $716 | $13,780 | $3,230 | $10,550 |
| 2017 | $695 | $13,780 | $3,230 | $10,550 |
| 2016 | $688 | $12,990 | $3,230 | $9,760 |
| 2015 | $345 | $12,990 | $3,230 | $9,760 |
| 2014 | $330 | $12,990 | $3,230 | $9,760 |
Source: Public Records
Map
Nearby Homes