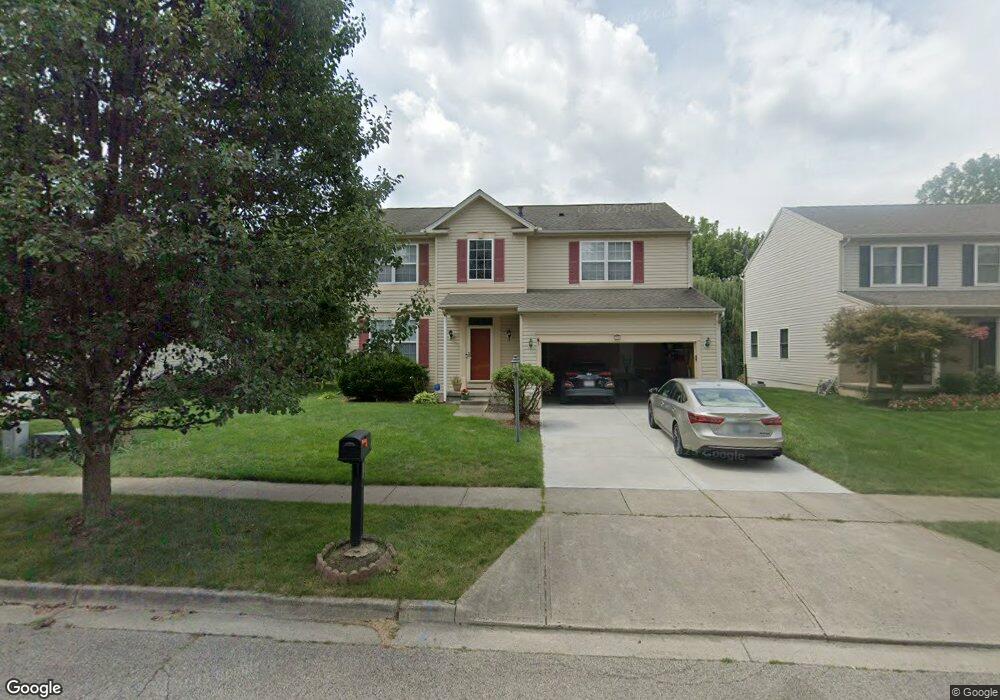
329 Wayside Dr Beavercreek, OH 45440
Estimated Value: $348,000 - $378,000
4
Beds
3
Baths
1,824
Sq Ft
$201/Sq Ft
Est. Value
About This Home
This home is located at 329 Wayside Dr, Beavercreek, OH 45440 and is currently estimated at $366,606, approximately $200 per square foot. 329 Wayside Dr is a home located in Greene County with nearby schools including Fairbrook Elementary School, Herman K Ankeney Middle School, and Beavercreek High School.
Ownership History
Date
Name
Owned For
Owner Type
Purchase Details
Closed on
Feb 28, 2006
Sold by
Aponte Hector R and Aponte Tina M
Bought by
Mohamed Abdillah H and Mohamed Amina A
Current Estimated Value
Home Financials for this Owner
Home Financials are based on the most recent Mortgage that was taken out on this home.
Original Mortgage
$157,440
Interest Rate
5.26%
Mortgage Type
Fannie Mae Freddie Mac
Purchase Details
Closed on
May 22, 2003
Sold by
Myers David S and Myers Joanne B
Bought by
Aponte Hector R and Aponte Tina M
Home Financials for this Owner
Home Financials are based on the most recent Mortgage that was taken out on this home.
Original Mortgage
$181,560
Interest Rate
5.9%
Mortgage Type
VA
Purchase Details
Closed on
Sep 1, 2001
Sold by
The Ryland Group Inc
Bought by
Myers David S and Myers Joanne B
Home Financials for this Owner
Home Financials are based on the most recent Mortgage that was taken out on this home.
Original Mortgage
$161,500
Interest Rate
6.99%
Create a Home Valuation Report for This Property
The Home Valuation Report is an in-depth analysis detailing your home's value as well as a comparison with similar homes in the area
Home Values in the Area
Average Home Value in this Area
Purchase History
| Date | Buyer | Sale Price | Title Company |
|---|---|---|---|
| Mohamed Abdillah H | $196,800 | None Available | |
| Aponte Hector R | $178,000 | -- | |
| Myers David S | $170,000 | Ryland Title |
Source: Public Records
Mortgage History
| Date | Status | Borrower | Loan Amount |
|---|---|---|---|
| Closed | Mohamed Abdillah H | $157,440 | |
| Closed | Aponte Hector R | $181,560 | |
| Closed | Myers David S | $161,500 |
Source: Public Records
Tax History Compared to Growth
Tax History
| Year | Tax Paid | Tax Assessment Tax Assessment Total Assessment is a certain percentage of the fair market value that is determined by local assessors to be the total taxable value of land and additions on the property. | Land | Improvement |
|---|---|---|---|---|
| 2024 | $6,448 | $98,760 | $24,770 | $73,990 |
| 2023 | $6,448 | $98,760 | $24,770 | $73,990 |
| 2022 | $5,714 | $77,260 | $19,060 | $58,200 |
| 2021 | $5,598 | $77,260 | $19,060 | $58,200 |
| 2020 | $5,640 | $77,260 | $19,060 | $58,200 |
| 2019 | $5,022 | $62,800 | $13,350 | $49,450 |
| 2018 | $4,433 | $62,800 | $13,350 | $49,450 |
| 2017 | $4,357 | $62,800 | $13,350 | $49,450 |
| 2016 | $4,575 | $62,800 | $13,350 | $49,450 |
| 2015 | $4,548 | $62,800 | $13,350 | $49,450 |
| 2014 | $4,480 | $62,800 | $13,350 | $49,450 |
Source: Public Records
Map
Nearby Homes
- 4489 Bucksport Ct
- 4493 Bucksport Ct
- 470 Cloverhill Ct
- 3170 E Stroop Rd
- 3170 E Stroop Rd Unit 307
- 4212 Seema Dr
- 4227 Wagner Rd
- 3073 Santa Rosa Dr
- 3033 Glenmere Ct
- 2841 Corlington Dr
- 3072 Leonora Dr
- 2816 Corlington Dr
- 419 Carleton Dr
- 3241 Gracemore Ave
- 4049 Pepperwell Cir
- 861 Acorn Dr
- 3878 Pepperwell Cir
- 3034 Sandywood Dr
- 3899 Pepperwell Cir
- 3117 Swigert Rd
- 335 Wayside Dr
- 323 Wayside Dr
- 317 Wayside Dr
- 341 Wayside Dr
- 311 Wayside Dr
- 4297 Wiltshire Ct
- 349 Wayside Dr
- 305 Wayside Dr
- 334 Wayside Dr
- 4289 Wiltshire Ct
- 340 Wayside Dr
- 357 Wayside Dr
- 299 Wayside Dr
- 4296 Wiltshire Ct
- 4281 Wiltshire Ct
- 293 Wayside Dr
- 4314 Marquette Dr
- 4288 Wiltshire Ct
- 365 Wayside Dr
- 4278 Wiltshire Ct