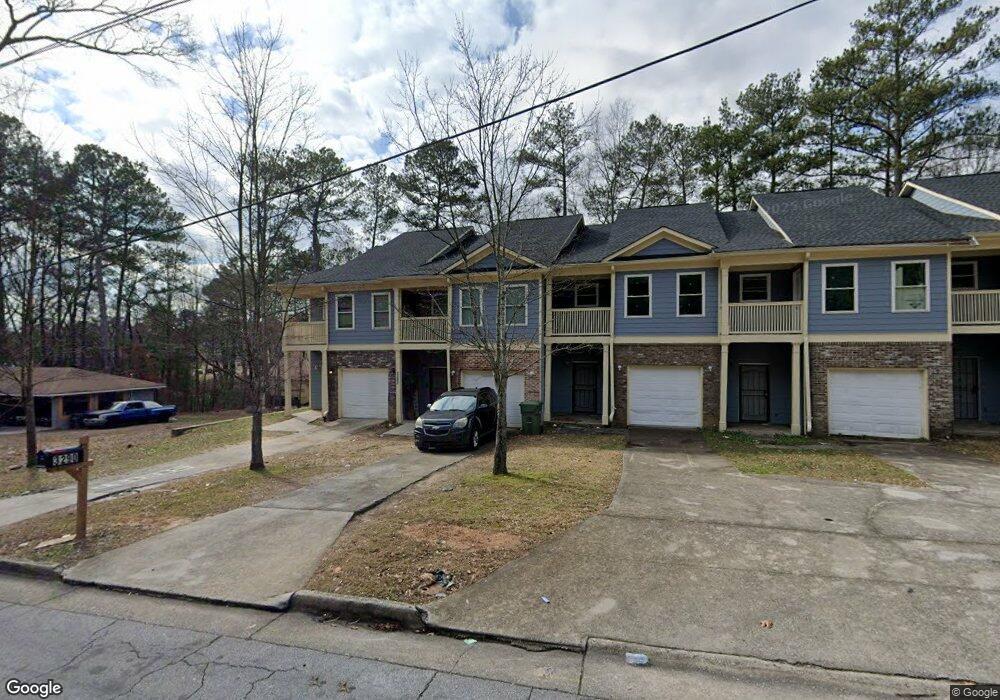
3290 Cushman Cir SW Atlanta, GA 30311
Estimated Value: $139,000 - $333,000
3
Beds
4
Baths
2,400
Sq Ft
$93/Sq Ft
Est. Value
About This Home
This home is located at 3290 Cushman Cir SW, Atlanta, GA 30311 and is currently estimated at $222,604, approximately $92 per square foot. 3290 Cushman Cir SW is a home located in Fulton County with nearby schools including West Manor Elementary School, Young Middle School, and Mays High School.
Ownership History
Date
Name
Owned For
Owner Type
Purchase Details
Closed on
Nov 30, 2020
Sold by
Sawa Partners Llc
Bought by
Ira Financial Llc
Current Estimated Value
Purchase Details
Closed on
Dec 31, 2014
Sold by
Pn Holdings Llc
Bought by
Atlanta Quality Properties Llc
Purchase Details
Closed on
Nov 19, 2014
Sold by
Capital Mtg Corp
Bought by
Pn Holdings Llc
Purchase Details
Closed on
Dec 4, 2012
Sold by
Capital Mtg Corp
Bought by
Capital Mtg Corp
Purchase Details
Closed on
Oct 7, 2008
Sold by
Whiteman Technologies Llc
Bought by
Woodrick George
Home Financials for this Owner
Home Financials are based on the most recent Mortgage that was taken out on this home.
Original Mortgage
$116,250
Interest Rate
6.01%
Mortgage Type
New Conventional
Purchase Details
Closed on
Mar 11, 2007
Sold by
Trebloc Ents Inc
Bought by
Spellman Lizzie
Create a Home Valuation Report for This Property
The Home Valuation Report is an in-depth analysis detailing your home's value as well as a comparison with similar homes in the area
Home Values in the Area
Average Home Value in this Area
Purchase History
| Date | Buyer | Sale Price | Title Company |
|---|---|---|---|
| Ira Financial Llc | $225,000 | -- | |
| Atlanta Quality Properties Llc | $68,750 | -- | |
| Pn Holdings Llc | $75,000 | -- | |
| Capital Mtg Corp | $175,000 | -- | |
| Woodrick George | $155,000 | -- | |
| Spellman Lizzie | -- | -- |
Source: Public Records
Mortgage History
| Date | Status | Borrower | Loan Amount |
|---|---|---|---|
| Previous Owner | Woodrick George | $116,250 |
Source: Public Records
Tax History Compared to Growth
Tax History
| Year | Tax Paid | Tax Assessment Tax Assessment Total Assessment is a certain percentage of the fair market value that is determined by local assessors to be the total taxable value of land and additions on the property. | Land | Improvement |
|---|---|---|---|---|
| 2025 | $772 | $24,200 | $3,440 | $20,760 |
| 2023 | $1,002 | $24,200 | $3,440 | $20,760 |
| 2022 | $979 | $24,200 | $3,440 | $20,760 |
| 2021 | $953 | $23,520 | $3,360 | $20,160 |
| 2020 | $952 | $23,240 | $3,320 | $19,920 |
| 2019 | $352 | $18,600 | $2,840 | $15,760 |
| 2018 | $752 | $18,160 | $2,760 | $15,400 |
| 2017 | $755 | $17,480 | $2,680 | $14,800 |
| 2016 | $757 | $17,480 | $2,680 | $14,800 |
| 2015 | $1,194 | $21,440 | $2,680 | $18,760 |
| 2014 | $1,188 | $26,200 | $3,720 | $22,480 |
Source: Public Records
Map
Nearby Homes
- 3152 Boulder Park Dr SW
- 3406 Boulder Park Dr SW
- 400 Brownlee Rd SW
- 187 Brownlee Rd SW
- 202 Nathan Rd SW
- 132 Brownlee Rd SW
- 218 Nathan Rd SW
- 3212 Delmar Ln NW
- 886 Society Cir SW
- 844 Venture Way
- 3080 Lynhurst Cir SW
- 3152 Delmar Ln NW
- 3199 Delmar Ln NW
- 3140 Delmar Ln NW
- 3346 Delmar Ln NW
- 852 Venture Way SW
- 128 Nathan Rd SW
- 847 Venture Way SW
- 915 Society Cir SW
- 3494 Boulder Park Dr SW
- 3292 Cushman Cir SW
- 3288 Cushman Cir SW
- 3294 Cushman Cir SW
- 3296 Cushman Cir SW
- 3298 Cushman Cir SW
- 3264 Cushman Cir SW
- Lot 2 Boulder Park Dr
- 3216 Boulder Park Dr SW
- 3200 Boulder Park Dr SW
- 3232 Martin Luther King jr Dr SW
- 3232 SW Martin Luther King Dr SW
- 0 Cushman Cir SW Unit 7513489
- 3230 Cushman Cir SW
- 3230 Cushman Cir SW
- 3174 Boulder Park Dr SW
- 3212 Martin Luther King jr Dr SW
- 3212 Martin Luther King Jr Drive and Gordon Rd Dr SW
- 3162 Boulder Park Dr SW
- 3167 Cushman Cir SW
- 294 Brownlee Rd SW