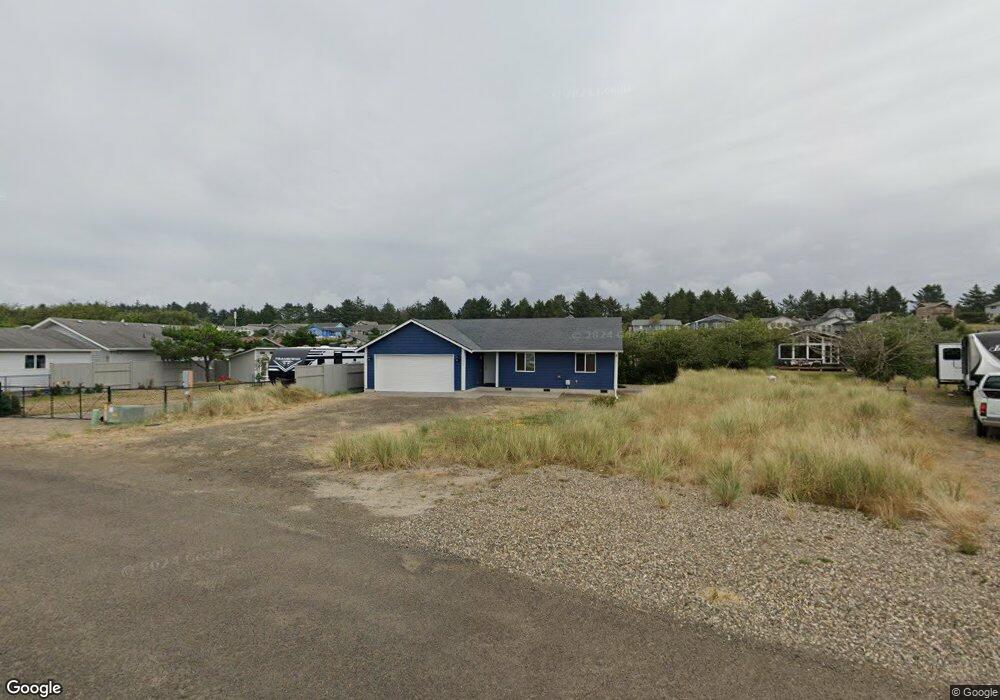
32900 G Place Ocean Park, WA 98640
Estimated Value: $358,585 - $432,000
--
Bed
--
Bath
1,280
Sq Ft
$314/Sq Ft
Est. Value
About This Home
This home is located at 32900 G Place, Ocean Park, WA 98640 and is currently estimated at $401,396, approximately $313 per square foot. 32900 G Place is a home located in Pacific County with nearby schools including Ilwaco Senior High School.
Ownership History
Date
Name
Owned For
Owner Type
Purchase Details
Closed on
Aug 15, 2013
Sold by
Waverly Jon
Bought by
Waverly Jonathan C
Current Estimated Value
Home Financials for this Owner
Home Financials are based on the most recent Mortgage that was taken out on this home.
Original Mortgage
$116,000
Outstanding Balance
$86,677
Interest Rate
4.51%
Estimated Equity
$314,719
Purchase Details
Closed on
Oct 5, 2009
Sold by
Waverly Brian J and Waverly Alyce P
Bought by
Waverly Ben and Waverly Jon
Create a Home Valuation Report for This Property
The Home Valuation Report is an in-depth analysis detailing your home's value as well as a comparison with similar homes in the area
Home Values in the Area
Average Home Value in this Area
Purchase History
| Date | Buyer | Sale Price | Title Company |
|---|---|---|---|
| Waverly Jonathan C | -- | Pacific County Title Co | |
| Waverly Benjamin J | -- | Pacific County Title Co | |
| Waverly Ben | -- | None Available |
Source: Public Records
Mortgage History
| Date | Status | Borrower | Loan Amount |
|---|---|---|---|
| Open | Waverly Benjamin J | $116,000 |
Source: Public Records
Tax History Compared to Growth
Tax History
| Year | Tax Paid | Tax Assessment Tax Assessment Total Assessment is a certain percentage of the fair market value that is determined by local assessors to be the total taxable value of land and additions on the property. | Land | Improvement |
|---|---|---|---|---|
| 2025 | $2,590 | $361,800 | $108,000 | $253,800 |
| 2024 | $2,590 | $361,800 | $108,000 | $253,800 |
| 2023 | $2,597 | $331,200 | $61,100 | $270,100 |
| 2022 | $2,601 | $240,700 | $36,300 | $204,400 |
| 2021 | $2,654 | $225,700 | $33,000 | $192,700 |
| 2020 | $2,661 | $208,200 | $33,000 | $175,200 |
| 2019 | $2,397 | $186,300 | $33,000 | $153,300 |
| 2018 | $2,540 | $172,400 | $45,000 | $127,400 |
| 2017 | $2,410 | $172,400 | $45,000 | $127,400 |
| 2015 | $2,195 | $155,800 | $45,000 | $110,800 |
| 2014 | -- | $155,800 | $45,000 | $110,800 |
| 2012 | -- | $89,200 | $45,000 | $44,200 |
Source: Public Records
Map
Nearby Homes