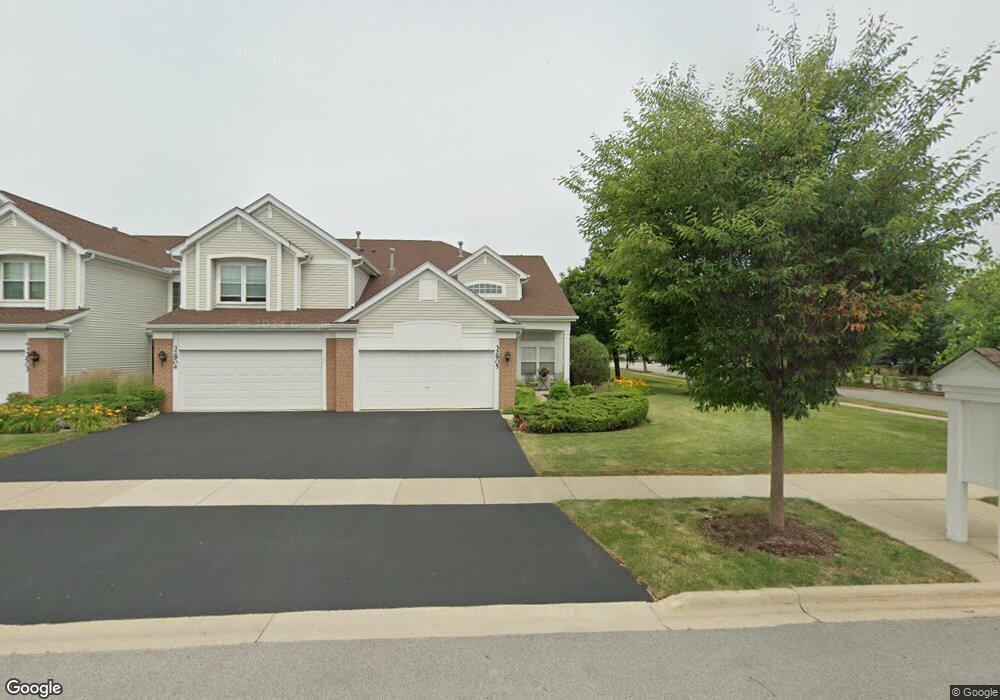
32905 Fowler Cir Warrenville, IL 60555
Estimated Value: $402,512 - $420,000
--
Bed
--
Bath
1,905
Sq Ft
$216/Sq Ft
Est. Value
About This Home
This home is located at 32905 Fowler Cir, Warrenville, IL 60555 and is currently estimated at $410,878, approximately $215 per square foot. 32905 Fowler Cir is a home located in DuPage County with nearby schools including Bower Elementary School, Hubble Middle School, and Wheaton Warrenville South High School.
Ownership History
Date
Name
Owned For
Owner Type
Purchase Details
Closed on
Mar 31, 2014
Sold by
Duncan Howard C
Bought by
Duncan Howard Charles and Howard Charles Duncan Living Trust
Current Estimated Value
Purchase Details
Closed on
Mar 24, 2010
Sold by
Duncan Howard
Bought by
Howard Charles Duncan Trust
Purchase Details
Closed on
Jan 23, 2006
Sold by
Duncan Howard C
Bought by
Howard C Duncan Trust
Purchase Details
Closed on
Sep 10, 2004
Sold by
Rasool Ahmed A and Rasool Azmeen
Bought by
Duncan Howard
Purchase Details
Closed on
Apr 1, 1999
Sold by
Cantera Village Llc
Bought by
Rasool Ahmed and Rasool Azmeen
Home Financials for this Owner
Home Financials are based on the most recent Mortgage that was taken out on this home.
Original Mortgage
$200,500
Interest Rate
7.04%
Mortgage Type
Purchase Money Mortgage
Create a Home Valuation Report for This Property
The Home Valuation Report is an in-depth analysis detailing your home's value as well as a comparison with similar homes in the area
Home Values in the Area
Average Home Value in this Area
Purchase History
| Date | Buyer | Sale Price | Title Company |
|---|---|---|---|
| Duncan Howard Charles | -- | None Available | |
| Howard Charles Duncan Trust | -- | None Available | |
| Howard C Duncan Trust | -- | None Available | |
| Duncan Howard | $260,000 | -- | |
| Rasool Ahmed | $211,500 | -- |
Source: Public Records
Mortgage History
| Date | Status | Borrower | Loan Amount |
|---|---|---|---|
| Previous Owner | Rasool Ahmed | $200,500 |
Source: Public Records
Tax History Compared to Growth
Tax History
| Year | Tax Paid | Tax Assessment Tax Assessment Total Assessment is a certain percentage of the fair market value that is determined by local assessors to be the total taxable value of land and additions on the property. | Land | Improvement |
|---|---|---|---|---|
| 2024 | -- | $110,125 | $10,850 | $99,275 |
| 2023 | $7,071 | $100,580 | $9,910 | $90,670 |
| 2022 | $6,777 | $94,010 | $9,260 | $84,750 |
| 2021 | $6,431 | $90,120 | $8,880 | $81,240 |
| 2020 | $6,265 | $87,380 | $8,610 | $78,770 |
| 2019 | $5,978 | $83,210 | $8,200 | $75,010 |
| 2018 | $5,795 | $80,790 | $7,960 | $72,830 |
| 2017 | $5,634 | $76,760 | $7,560 | $69,200 |
| 2016 | $5,413 | $71,570 | $7,050 | $64,520 |
| 2015 | $5,206 | $66,250 | $6,530 | $59,720 |
| 2014 | $5,031 | $63,100 | $6,220 | $56,880 |
| 2013 | $5,065 | $65,410 | $6,450 | $58,960 |
Source: Public Records
Map
Nearby Homes
- 31104 Carpenter Ct
- 31306 Kline Cir
- 27W680 Warrenville Rd
- 28W041 Greenview Ave
- 27 Wilbur Ave
- 28W544 Rogers Ave
- 28W556 Forestview Dr
- 28W686 Townline Rd
- 28W773 Stafford Place
- 3S281 Rockwell St
- 3S210 Herrick Rd
- 1209 W Bauer Rd
- 27W376 Hoy Rd
- 1109 W Bauer Rd
- 3S656 Landon Ave
- 1105 W Bauer Rd
- 1519 Wedgefield Cir
- 1518 Wedgefield Cir
- 1432 Calcutta Ln
- 3S389 Chestnut Ct
- 32904 Fowler Cir
- 32903 Fowler Cir
- 32902 Fowler Cir
- 32901 Fowler Cir
- 32806 Fowler Cir
- 32806 Fowler Cir Unit 806
- 30101 Fowler Cir
- 30504 Fowler Cir
- 30505 Fowler Cir
- 30506 Fowler Cir
- 30503 Fowler Cir
- 30502 Fowler Cir
- 30102 Fowler Cir
- 30501 Fowler Cir
- 30103 Fowler Cir
- 32804 Fowler Cir
- 30406 Fowler Cir
- 30201 Fowler Cir
- 30104 Fowler Cir
- 32803 Fowler Cir