Estimated Value: $353,000 - $436,000
Studio
1
Bath
1,468
Sq Ft
$261/Sq Ft
Est. Value
About This Home
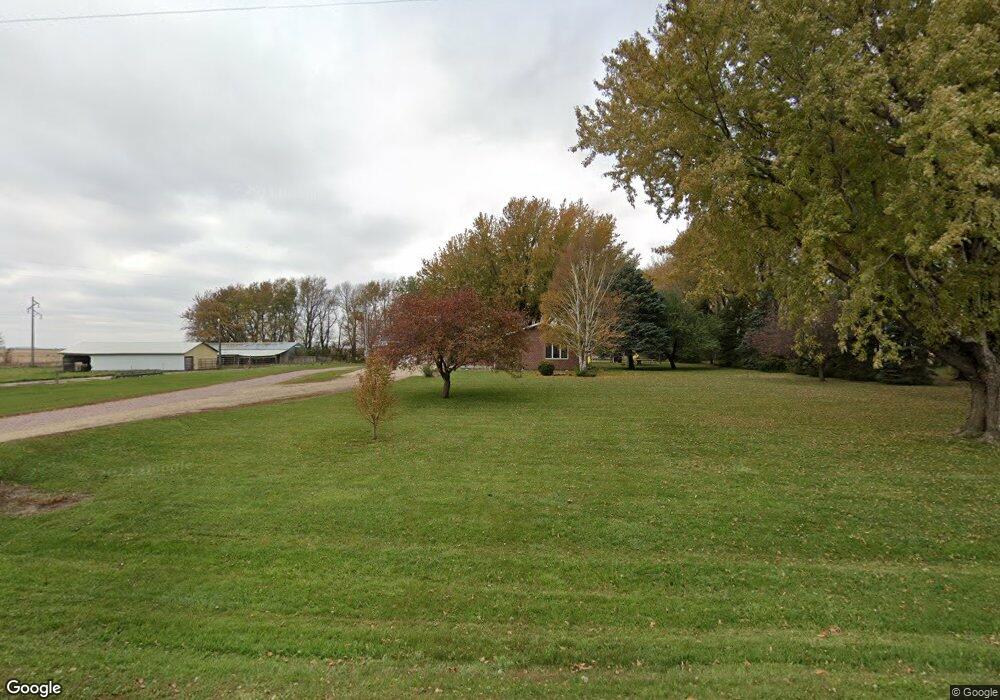
This home is located at 3291 Grant Ave, Hull, IA 51239 and is currently estimated at $383,136, approximately $260 per square foot. 3291 Grant Ave is a home located in Sioux County with nearby schools including Boyden-Hull Elementary School, Boyden-Hull High School, and Hull Protestant Reformed Christian School.
Ownership History
Date
Name
Owned For
Owner Type
Purchase Details
Closed on
Oct 8, 2009
Sold by
Hoksbergen Craig D and Hoksbergen Heather J
Bought by
Moss Andrew J and Moss Amanda J
Current Estimated Value
Home Financials for this Owner
Home Financials are based on the most recent Mortgage that was taken out on this home.
Original Mortgage
$125,000
Outstanding Balance
$80,537
Interest Rate
4.9%
Mortgage Type
New Conventional
Estimated Equity
$302,599
Create a Home Valuation Report for This Property
The Home Valuation Report is an in-depth analysis detailing your home's value as well as a comparison with similar homes in the area
Purchase History
| Date | Buyer | Sale Price | Title Company |
|---|---|---|---|
| Moss Andrew J | $175,000 | None Available |
Source: Public Records
Mortgage History
| Date | Status | Borrower | Loan Amount |
|---|---|---|---|
| Open | Moss Andrew J | $125,000 |
Source: Public Records
Tax History
| Year | Tax Paid | Tax Assessment Tax Assessment Total Assessment is a certain percentage of the fair market value that is determined by local assessors to be the total taxable value of land and additions on the property. | Land | Improvement |
|---|---|---|---|---|
| 2025 | $2,864 | $354,750 | $39,750 | $315,000 |
| 2024 | $2,864 | $294,500 | $39,750 | $254,750 |
| 2023 | $2,818 | $294,500 | $39,750 | $254,750 |
| 2022 | $2,672 | $245,150 | $26,300 | $218,850 |
| 2021 | $2,540 | $241,620 | $26,300 | $215,320 |
| 2020 | $2,540 | $214,350 | $26,300 | $188,050 |
| 2019 | $2,424 | $194,470 | $26,300 | $168,170 |
| 2018 | $2,408 | $194,470 | $26,300 | $168,170 |
| 2017 | $2,408 | $195,440 | $26,300 | $169,140 |
| 2014 | $1,934 | $158,460 | $0 | $0 |
Source: Public Records
Map
Nearby Homes
- 301 Black Forest Rd
- 3273 Hickory Ave
- 423 Railroad St
- 1509 Birch St
- 1208 2nd St
- 1107 4th St
- 1219 3rd St
- 1502 2nd St
- 2014 Maple St
- 1311 Aspen St
- 1818 1st St
- 2629 Warren Cir
- 1495 Jefferson Ln
- 1489 Jefferson Ln
- 1485 Jefferson Ln
- 1477 Jefferson Ln
- 1465 Jefferson Ln
- 2038 12th St
- 1801 9th St SE
- 1025 18th Ave
Your Personal Tour Guide
Ask me questions while you tour the home.