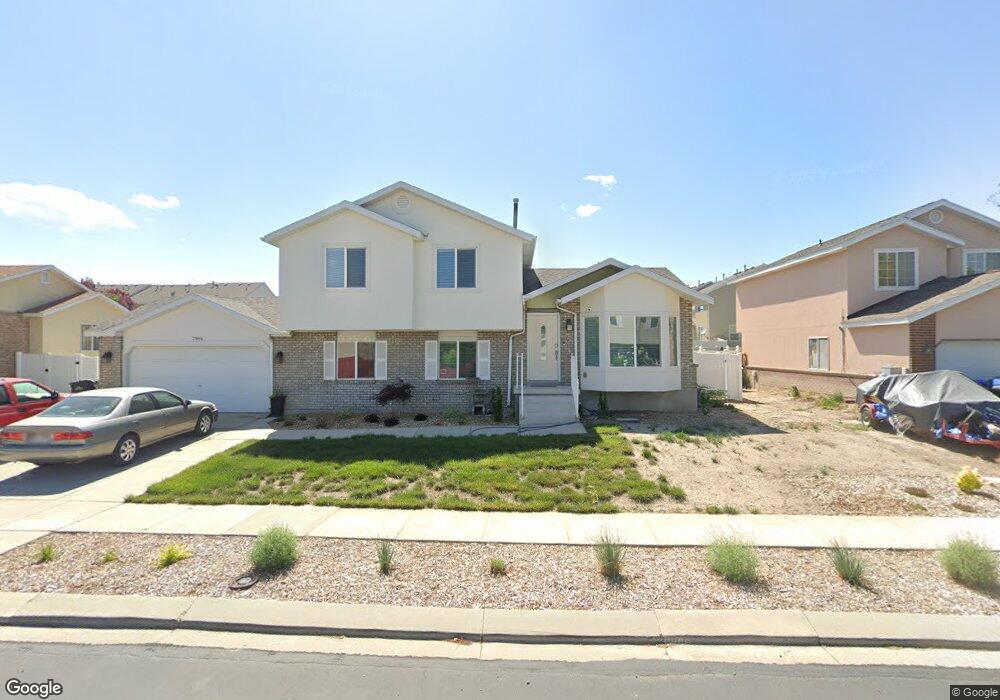
3292 Lower Huntly Way West Jordan, UT 84088
Estimated Value: $424,000 - $438,365
3
Beds
3
Baths
1,510
Sq Ft
$286/Sq Ft
Est. Value
About This Home
This home is located at 3292 Lower Huntly Way, West Jordan, UT 84088 and is currently estimated at $431,841, approximately $285 per square foot. 3292 Lower Huntly Way is a home located in Salt Lake County with nearby schools including Columbia Elementary School, Joel P. Jensen Middle School, and West Jordan High School.
Ownership History
Date
Name
Owned For
Owner Type
Purchase Details
Closed on
Jun 26, 2008
Sold by
Callahan Gerald W and Callahan Desri M
Bought by
Richards Roylene
Current Estimated Value
Home Financials for this Owner
Home Financials are based on the most recent Mortgage that was taken out on this home.
Original Mortgage
$188,100
Outstanding Balance
$119,364
Interest Rate
5.75%
Mortgage Type
Purchase Money Mortgage
Estimated Equity
$312,477
Purchase Details
Closed on
Jul 29, 2003
Sold by
Lismore Llc
Bought by
Callahan Gerald W and Callahan Desri M
Home Financials for this Owner
Home Financials are based on the most recent Mortgage that was taken out on this home.
Original Mortgage
$150,720
Interest Rate
5.17%
Mortgage Type
FHA
Create a Home Valuation Report for This Property
The Home Valuation Report is an in-depth analysis detailing your home's value as well as a comparison with similar homes in the area
Home Values in the Area
Average Home Value in this Area
Purchase History
| Date | Buyer | Sale Price | Title Company |
|---|---|---|---|
| Richards Roylene | -- | First American Title | |
| Callahan Gerald W | -- | Us Title Of Utah |
Source: Public Records
Mortgage History
| Date | Status | Borrower | Loan Amount |
|---|---|---|---|
| Open | Richards Roylene | $188,100 | |
| Previous Owner | Callahan Gerald W | $150,720 |
Source: Public Records
Tax History Compared to Growth
Tax History
| Year | Tax Paid | Tax Assessment Tax Assessment Total Assessment is a certain percentage of the fair market value that is determined by local assessors to be the total taxable value of land and additions on the property. | Land | Improvement |
|---|---|---|---|---|
| 2025 | $2,182 | $432,200 | $81,000 | $351,200 |
| 2024 | $2,182 | $419,900 | $78,300 | $341,600 |
| 2023 | $2,172 | $393,900 | $73,900 | $320,000 |
| 2022 | $2,246 | $400,600 | $72,500 | $328,100 |
| 2021 | $1,881 | $305,500 | $54,400 | $251,100 |
| 2020 | $1,632 | $248,700 | $54,400 | $194,300 |
| 2019 | $1,635 | $244,400 | $54,400 | $190,000 |
| 2018 | $1,506 | $223,200 | $52,400 | $170,800 |
| 2017 | $1,426 | $210,400 | $52,400 | $158,000 |
| 2016 | $1,395 | $193,400 | $57,400 | $136,000 |
| 2015 | $1,359 | $183,700 | $58,500 | $125,200 |
| 2014 | $1,294 | $172,300 | $55,800 | $116,500 |
Source: Public Records
Map
Nearby Homes
- 3332 Lower Newark Way
- 8058 S Lismore Ln Unit 304
- 8180 S Old Bingham Hwy
- 3476 W Spaulding Rd
- 3546 W 7980 S
- 3354 W 7800 S
- 3066 W Linton Dr
- 3165 W 7720 S
- 7987 S 2980 W
- 3422 Briar Dr
- 3629 W 7825 S
- 3647 W 7865 S
- 7611 S Springbrook Dr
- 3112 Green Acre Dr
- 7991 S 3725 W
- 7989 S 3725 W
- 8407 Meadow Green Way
- 7942 S 2800 W
- 8493 S 3200 W
- 7721 Sunset Cir
- 3294 Lower Huntly Way
- 3298 Lower Huntly Way
- 3298 W Lower Huntly Way
- 3302 W Lower Huntly Way
- 3302 Lower Huntly Way
- 3289 Upper Huntly Way
- 3293 Upper Huntly Way
- 3289 W Upper Huntly Way
- 3297 Upper Huntly Way
- 3297 W Upper Huntly Way
- 3299 Upper Huntly Way
- 8003 Cardoness Way
- 8003 S Cardoness Way
- 3308 Lower Huntly Way
- 3308 W Lower Huntly Way
- 7994 S 3260 W
- 3303 Upper Huntly Way Unit 217
- 8007 Cardoness Way
- 8007 S Cardoness Way
- 3312 Lower Huntly Way