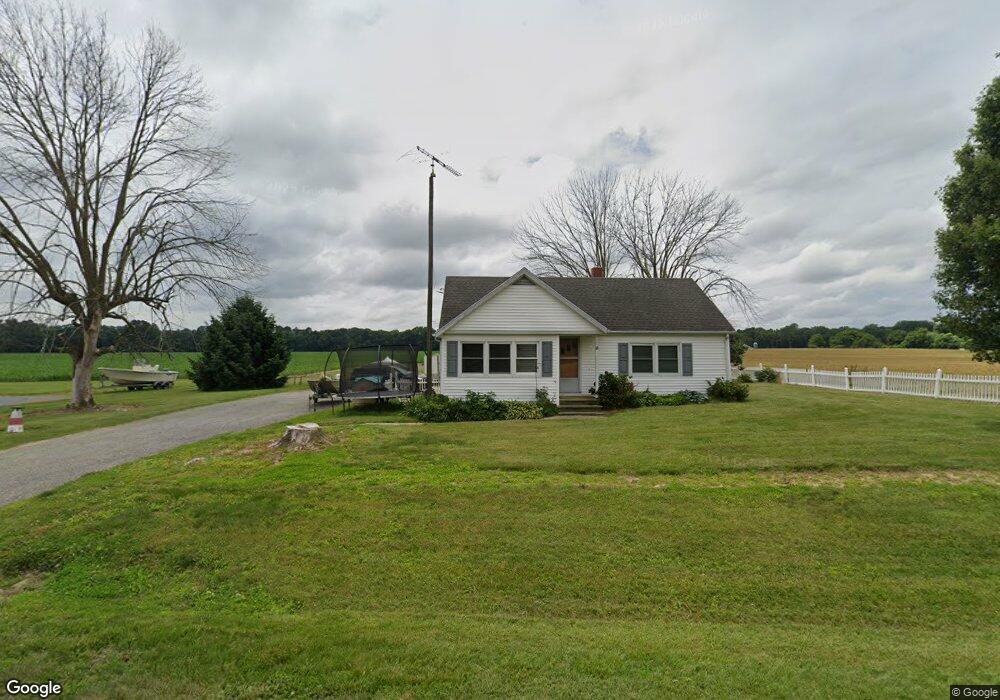
32949 Reeses Landing Rd Cordova, MD 21625
Estimated Value: $259,000 - $358,000
--
Bed
1
Bath
848
Sq Ft
$368/Sq Ft
Est. Value
About This Home
This home is located at 32949 Reeses Landing Rd, Cordova, MD 21625 and is currently estimated at $311,740, approximately $367 per square foot. 32949 Reeses Landing Rd is a home located in Talbot County with nearby schools including Chapel District Elementary School, Easton Middle School, and Easton High School.
Ownership History
Date
Name
Owned For
Owner Type
Purchase Details
Closed on
Sep 12, 2007
Sold by
Deprima Karen A
Bought by
Deprima Karen A and Gownley Shane K
Current Estimated Value
Home Financials for this Owner
Home Financials are based on the most recent Mortgage that was taken out on this home.
Original Mortgage
$240,000
Outstanding Balance
$153,270
Interest Rate
6.74%
Mortgage Type
Purchase Money Mortgage
Estimated Equity
$158,470
Purchase Details
Closed on
Aug 29, 2007
Sold by
Labombard Noami M
Bought by
Deprima Karen A
Home Financials for this Owner
Home Financials are based on the most recent Mortgage that was taken out on this home.
Original Mortgage
$240,000
Outstanding Balance
$153,270
Interest Rate
6.74%
Mortgage Type
Purchase Money Mortgage
Estimated Equity
$158,470
Purchase Details
Closed on
Aug 24, 2007
Sold by
Deprima Karen A
Bought by
Deprima Karen A and Gownley Shane K
Home Financials for this Owner
Home Financials are based on the most recent Mortgage that was taken out on this home.
Original Mortgage
$240,000
Outstanding Balance
$153,270
Interest Rate
6.74%
Mortgage Type
Purchase Money Mortgage
Estimated Equity
$158,470
Purchase Details
Closed on
Jan 29, 2001
Sold by
Williams John F
Bought by
Pigo Edward A
Create a Home Valuation Report for This Property
The Home Valuation Report is an in-depth analysis detailing your home's value as well as a comparison with similar homes in the area
Home Values in the Area
Average Home Value in this Area
Purchase History
| Date | Buyer | Sale Price | Title Company |
|---|---|---|---|
| Deprima Karen A | -- | -- | |
| Deprima Karen A | $240,000 | -- | |
| Deprima Karen A | -- | -- | |
| Pigo Edward A | $154,500 | -- |
Source: Public Records
Mortgage History
| Date | Status | Borrower | Loan Amount |
|---|---|---|---|
| Open | Deprima Karen A | $240,000 |
Source: Public Records
Tax History Compared to Growth
Tax History
| Year | Tax Paid | Tax Assessment Tax Assessment Total Assessment is a certain percentage of the fair market value that is determined by local assessors to be the total taxable value of land and additions on the property. | Land | Improvement |
|---|---|---|---|---|
| 2025 | $1,684 | $190,933 | $0 | $0 |
| 2024 | $1,684 | $181,467 | $0 | $0 |
| 2023 | $1,471 | $172,000 | $80,000 | $92,000 |
| 2022 | $1,342 | $169,033 | $0 | $0 |
| 2021 | $2,771 | $166,067 | $0 | $0 |
| 2020 | $736 | $163,100 | $80,000 | $83,100 |
| 2019 | $1,235 | $158,133 | $0 | $0 |
| 2018 | $1,072 | $153,167 | $0 | $0 |
| 2017 | $1,037 | $148,200 | $0 | $0 |
| 2016 | $1,012 | $148,200 | $0 | $0 |
| 2015 | $1,097 | $148,200 | $0 | $0 |
| 2014 | $1,097 | $173,700 | $0 | $0 |
Source: Public Records
Map
Nearby Homes
- 33293 Matthewstown Rd
- 8259 Haven St
- 8578 Tuckahoe Rd
- 0 Laurel Ln
- 23296 Wilder Way
- 7929 Laurel Ln
- 0 Quail Ct Unit MDCM2006644
- 31570 Miller Rd
- 10640 Kittys Corner Rd
- LOT #6 High Banks Dr
- 0 High Banks Dr
- 9059 High Banks Dr
- 0 Asbury Dr
- 6561 Bell Creek Rd
- 11482 Kittys Corner Rd
- 24276 Asbury Dr
- 24324 Asbury Dr
- 24383 Robins Creek Rd
- 23629 Willow Pond Rd
- 31127 Willis St
- 32959 Reeses Landing Rd
- 33000 Reeses Landing Rd
- 0 Reese Landing Rd Unit MDTA136214
- 0 Reese Landing Rd Unit MDTA139112
- 10475 Tuckahoe Bow Dr
- 10591 Tuckahoe Bow Dr
- 10545 Tuckahoe Bow Dr
- 10525 Tuckahoe Bow Dr
- 32893 Reeses Landing Rd
- 32856 Reeses Landing Rd
- 10400 Highfield Rd
- 32733 Reeses Landing Rd
- 32737 Reeses Landing Rd
- 32705 Reeses Landing Rd
- 32741 Reeses Landing Rd
- 22718 Meadowfield Ln
- 32661 Reeses Landing Rd
- 32698 Reeses Landing Rd
- 32646 Hidden Acres Rd
- 32609 Reeses Landing Rd