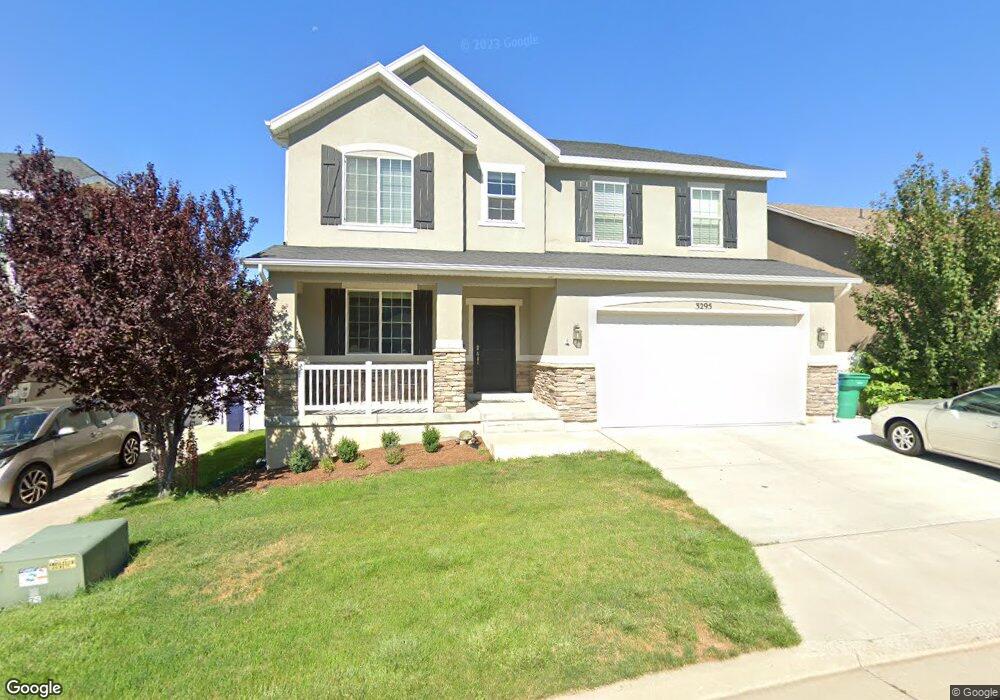
3295 N Falcon Way Unit 9 Layton, UT 84040
Estimated Value: $582,000 - $625,000
4
Beds
3
Baths
3,550
Sq Ft
$170/Sq Ft
Est. Value
About This Home
This home is located at 3295 N Falcon Way Unit 9, Layton, UT 84040 and is currently estimated at $603,928, approximately $170 per square foot. 3295 N Falcon Way Unit 9 is a home located in Davis County with nearby schools including Mountain View Elementary School, North Layton Junior High School, and Northridge High School.
Ownership History
Date
Name
Owned For
Owner Type
Purchase Details
Closed on
Aug 18, 2016
Sold by
Yoshimura Corey R
Bought by
Schaffer Peter
Current Estimated Value
Home Financials for this Owner
Home Financials are based on the most recent Mortgage that was taken out on this home.
Original Mortgage
$248,062
Outstanding Balance
$197,605
Interest Rate
3.43%
Estimated Equity
$406,323
Purchase Details
Closed on
Feb 13, 2014
Sold by
Richmond American Homes Of Utah Inc
Bought by
Yoshimura Corey R
Home Financials for this Owner
Home Financials are based on the most recent Mortgage that was taken out on this home.
Original Mortgage
$260,300
Interest Rate
4.49%
Mortgage Type
New Conventional
Purchase Details
Closed on
Oct 4, 2010
Sold by
Green Edward D
Bought by
Richmond American Homes Of Utah Inc
Purchase Details
Closed on
Aug 27, 2009
Sold by
Ed Green Construction Inc
Bought by
Green Edward D
Create a Home Valuation Report for This Property
The Home Valuation Report is an in-depth analysis detailing your home's value as well as a comparison with similar homes in the area
Home Values in the Area
Average Home Value in this Area
Purchase History
| Date | Buyer | Sale Price | Title Company |
|---|---|---|---|
| Schaffer Peter | -- | Stewart Title | |
| Yoshimura Corey R | -- | First American Title | |
| Richmond American Homes Of Utah Inc | -- | Lincoln Title Ins Agency | |
| Green Edward D | -- | Security Title Of Davis Co |
Source: Public Records
Mortgage History
| Date | Status | Borrower | Loan Amount |
|---|---|---|---|
| Open | Schaffer Peter | $248,062 | |
| Previous Owner | Yoshimura Corey R | $260,300 |
Source: Public Records
Tax History Compared to Growth
Tax History
| Year | Tax Paid | Tax Assessment Tax Assessment Total Assessment is a certain percentage of the fair market value that is determined by local assessors to be the total taxable value of land and additions on the property. | Land | Improvement |
|---|---|---|---|---|
| 2025 | $3,098 | $313,500 | $90,168 | $223,332 |
| 2024 | $2,945 | $301,400 | $118,576 | $182,824 |
| 2023 | $3,043 | $552,000 | $113,370 | $438,630 |
| 2022 | $3,181 | $314,050 | $59,331 | $254,719 |
| 2021 | $2,898 | $426,000 | $102,636 | $323,364 |
| 2020 | $2,601 | $366,000 | $75,687 | $290,313 |
| 2019 | $2,558 | $353,000 | $81,050 | $271,950 |
| 2018 | $2,316 | $320,000 | $79,249 | $240,751 |
| 2016 | $2,236 | $161,205 | $32,130 | $129,075 |
| 2015 | $2,167 | $148,830 | $32,130 | $116,700 |
| 2014 | $2,165 | $152,728 | $23,359 | $129,369 |
| 2013 | -- | $41,745 | $41,745 | $0 |
Source: Public Records
Map
Nearby Homes
- 3295 N Falcon Way
- 3309 N Falcon Way
- 3287 N Falcon Way
- 3319 N Falcon Way
- 3319 N Falcon Way Unit 11
- 3277 N Falcon Way
- 3277 N Falcon Way Unit 7
- 3292 N Falcon Way
- 3304 N Falcon Way
- 3304 N Falcon Way Unit 27
- 3284 N Falcon Way
- 3327 N Falcon Way
- 3327 N Falcon Way Unit 12
- 3314 N Falcon Way
- 3314 N Falcon Way Unit 26
- 3265 N Falcon Way
- 3276 N Falcon Way Unit 30
- 3276 N Falcon Way
- 3324 N Falcon Way
- 3324 N Falcon Way Unit 25