Estimated Value: $588,000 - $745,000
4
Beds
3
Baths
3,125
Sq Ft
$213/Sq Ft
Est. Value
About This Home
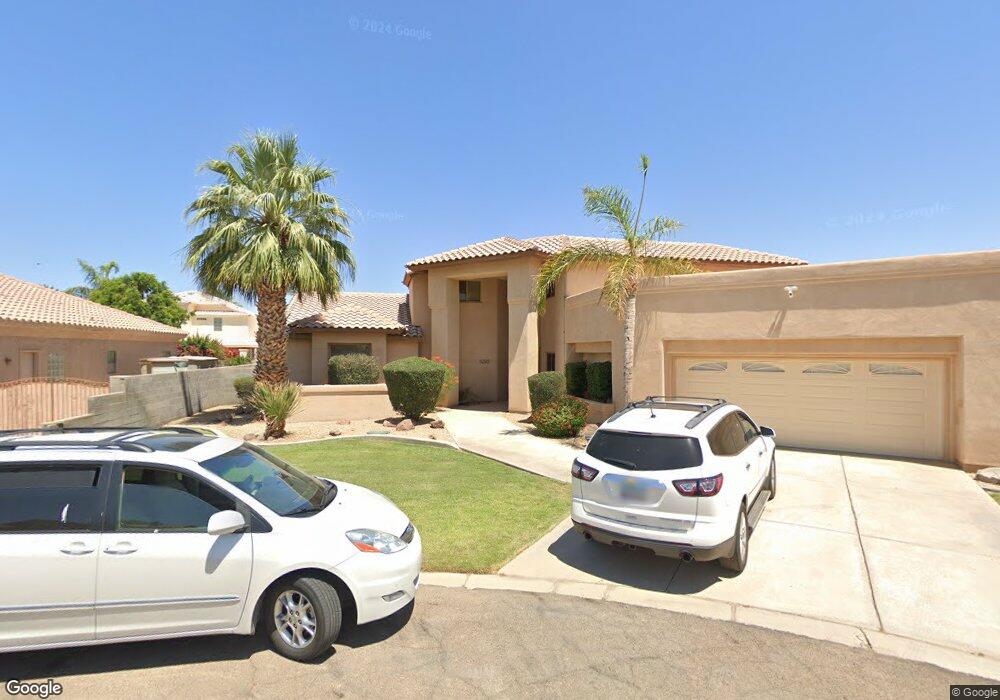
This home is located at 3295 S Palomino Way, Yuma, AZ 85365 and is currently estimated at $664,902, approximately $212 per square foot. 3295 S Palomino Way is a home located in Yuma County with nearby schools including Mesquite Elementary School, Crane Middle School, and Cibola High School.
Ownership History
Date
Name
Owned For
Owner Type
Purchase Details
Closed on
May 5, 2020
Sold by
Fletcher John R and Fletcher Gwenda L
Bought by
Fletcher John R and Fletcher Gwenda L
Current Estimated Value
Purchase Details
Closed on
Sep 22, 2000
Sold by
Mondragon Paul A and Mondragon Laurie L
Bought by
Fletcher John R and Fletcher Gwenda L Emerick
Home Financials for this Owner
Home Financials are based on the most recent Mortgage that was taken out on this home.
Original Mortgage
$238,400
Interest Rate
7.86%
Mortgage Type
New Conventional
Purchase Details
Closed on
Jan 26, 2000
Sold by
Tucker Michael S and Tucker Janet N
Bought by
Mondragon Paul A and Mondragon Laurie L
Home Financials for this Owner
Home Financials are based on the most recent Mortgage that was taken out on this home.
Original Mortgage
$252,700
Interest Rate
8.16%
Mortgage Type
New Conventional
Create a Home Valuation Report for This Property
The Home Valuation Report is an in-depth analysis detailing your home's value as well as a comparison with similar homes in the area
Home Values in the Area
Average Home Value in this Area
Purchase History
| Date | Buyer | Sale Price | Title Company |
|---|---|---|---|
| Fletcher John R | -- | None Available | |
| Fletcher John R | $298,000 | Yuma Title | |
| Mondragon Paul A | $268,000 | Citizens Title |
Source: Public Records
Mortgage History
| Date | Status | Borrower | Loan Amount |
|---|---|---|---|
| Previous Owner | Fletcher John R | $238,400 | |
| Previous Owner | Mondragon Paul A | $252,700 |
Source: Public Records
Tax History Compared to Growth
Tax History
| Year | Tax Paid | Tax Assessment Tax Assessment Total Assessment is a certain percentage of the fair market value that is determined by local assessors to be the total taxable value of land and additions on the property. | Land | Improvement |
|---|---|---|---|---|
| 2025 | $4,263 | $39,358 | $5,731 | $33,627 |
| 2024 | $4,070 | $37,484 | $5,720 | $31,764 |
| 2023 | $4,070 | $35,699 | $4,850 | $30,849 |
| 2022 | $3,948 | $34,000 | $5,148 | $28,852 |
| 2021 | $4,144 | $32,380 | $5,688 | $26,692 |
| 2020 | $4,020 | $30,838 | $4,429 | $26,409 |
| 2019 | $4,483 | $29,369 | $4,046 | $25,323 |
| 2018 | $4,188 | $27,971 | $3,895 | $24,076 |
| 2017 | $4,104 | $27,971 | $3,895 | $24,076 |
| 2016 | $4,019 | $25,371 | $4,950 | $20,421 |
| 2015 | $4,633 | $33,986 | $5,300 | $28,686 |
| 2014 | $4,633 | $33,183 | $8,166 | $25,017 |
Source: Public Records
Map
Nearby Homes
- 4260 W 31 Place
- 4237 W 31 Place
- 4261 W 31 Place
- 4224 W 31 Place
- 4236 W 31 Place
- 4248 W 31 Place
- 4599 W La Quinta Ln
- 4588 W La Quinta Ln
- 4655 W Sun Down Dr
- 3751 W 37th St
- 2784 S 44th Trail
- 4792 W 31st Place
- 3667 W 37th St
- 4491 W 27th St
- 4628 W 27th Ln
- 4634 W 27th Ln Unit 6
- 4191 W 25th St
- 2628 S 44th Trail
- 3690 Livingston Estates Ct
- 4429 W 25 Dr
- 3279 S Palomino Way
- 3294 S Pinto Way
- 3296 S Palomino Way
- 3278 S Pinto Way
- 3267 S Palomino Way
- 3280 S Palomino Way
- 3266 S Pinto Way
- 3268 S Palomino Way
- 3293 S Pinto Way
- 3269 S Pinto Way
- 4323 W Vaquero Ln
- 3243 S Palomino Way
- 3250 S Pinto Way
- 4322 W Vaquero Ln
- 3252 S Palomino Way
- 3292 S Morgan Way
- 3238 S Palomino Way
- 4181 W Arabian Ln
- 3232 S Pinto Way
- 4190 W Arabian Ln