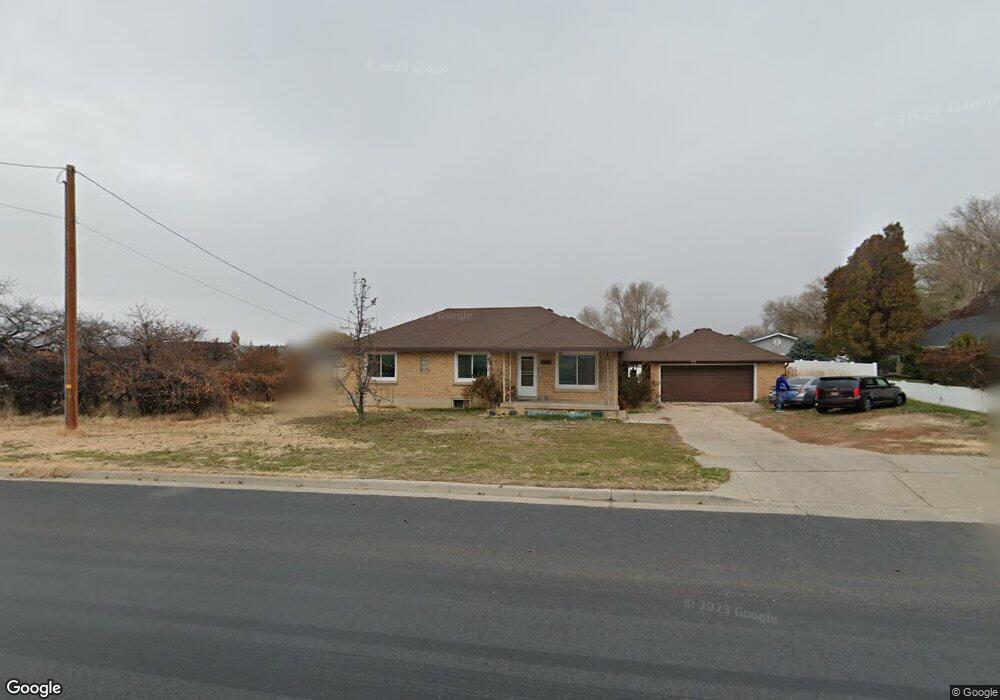
3296 W 1300 N Clearfield, UT 84015
Estimated Value: $418,000 - $513,000
3
Beds
1
Bath
1,466
Sq Ft
$309/Sq Ft
Est. Value
About This Home
This home is located at 3296 W 1300 N, Clearfield, UT 84015 and is currently estimated at $453,398, approximately $309 per square foot. 3296 W 1300 N is a home located in Davis County with nearby schools including West Point School, West Point Junior High School, and Syracuse High School.
Ownership History
Date
Name
Owned For
Owner Type
Purchase Details
Closed on
May 18, 2011
Sold by
Rawlings Steve S and Law Diane
Bought by
Bateman Robert and Bateman Carrie
Current Estimated Value
Purchase Details
Closed on
Jun 24, 1999
Sold by
Bateman Doris O and Oleson Glenn E
Bought by
Bateman Robert and Bateman Carrie
Home Financials for this Owner
Home Financials are based on the most recent Mortgage that was taken out on this home.
Original Mortgage
$89,422
Interest Rate
6.86%
Mortgage Type
FHA
Purchase Details
Closed on
May 26, 1999
Sold by
Bateman Doris O and Oleson Glenn E
Bought by
Bateman Robert and Bateman Carrie
Home Financials for this Owner
Home Financials are based on the most recent Mortgage that was taken out on this home.
Original Mortgage
$89,422
Interest Rate
6.86%
Mortgage Type
FHA
Create a Home Valuation Report for This Property
The Home Valuation Report is an in-depth analysis detailing your home's value as well as a comparison with similar homes in the area
Home Values in the Area
Average Home Value in this Area
Purchase History
| Date | Buyer | Sale Price | Title Company |
|---|---|---|---|
| Bateman Robert | -- | None Available | |
| Bateman Robert | -- | Bonneville Title Company Inc | |
| Bateman Robert | -- | Bonneville Title Company Inc |
Source: Public Records
Mortgage History
| Date | Status | Borrower | Loan Amount |
|---|---|---|---|
| Previous Owner | Bateman Robert | $89,422 |
Source: Public Records
Tax History Compared to Growth
Tax History
| Year | Tax Paid | Tax Assessment Tax Assessment Total Assessment is a certain percentage of the fair market value that is determined by local assessors to be the total taxable value of land and additions on the property. | Land | Improvement |
|---|---|---|---|---|
| 2025 | $2,345 | $225,500 | $118,980 | $106,520 |
| 2024 | $2,248 | $217,250 | $126,845 | $90,405 |
| 2023 | $2,058 | $368,000 | $151,279 | $216,721 |
| 2022 | $2,207 | $218,350 | $84,219 | $134,131 |
| 2021 | $2,139 | $314,000 | $119,739 | $194,261 |
| 2020 | $1,873 | $272,000 | $110,142 | $161,858 |
| 2019 | $1,677 | $238,000 | $113,492 | $124,508 |
| 2018 | $1,535 | $214,000 | $94,016 | $119,984 |
| 2016 | $1,374 | $98,890 | $38,227 | $60,663 |
| 2015 | $1,205 | $82,500 | $40,239 | $42,261 |
| 2014 | $1,433 | $99,632 | $40,239 | $59,393 |
| 2013 | -- | $92,679 | $37,090 | $55,589 |
Source: Public Records
Map
Nearby Homes
- 3168 W 1300 N
- 2921 W 1300 N
- 3941 W 1800 N
- 2816 W 960 N
- 3656 W 1800 N
- 3892 W 1450 N
- 2642 W 1500 N
- 2413 N Eurasian Crane Rd
- 3648 W 900 N Unit 207
- 3212 W 600 N
- 1251 N 2525 W
- 3877 W 825 N Unit WF21
- 3918 W 825 N Unit WF6
- 3932 W 825 N Unit WF5
- 878 N 2600 W
- 3721 W 825 N Unit 101
- 1449 N 2475 W
- 3187 W 525 N
- 1509 N 2475 W
- 1958 N 2750 W