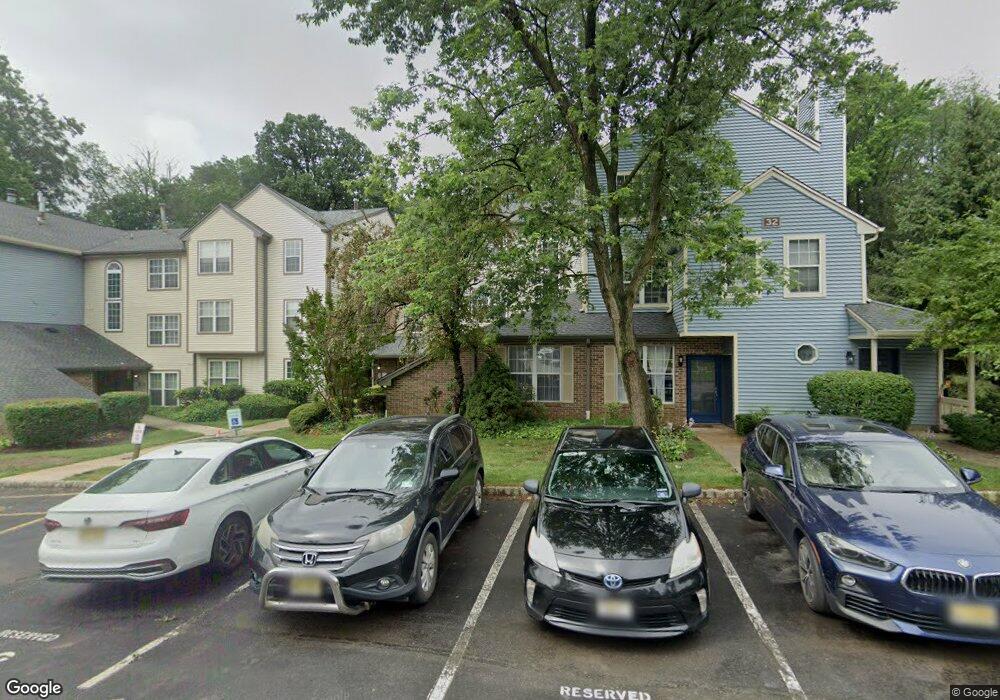
3298 Cypress Ct Unit 3321 Monmouth Junction, NJ 08852
Estimated Value: $348,000 - $414,283
2
Beds
2
Baths
--
Sq Ft
697
Sq Ft Lot
About This Home
This home is located at 3298 Cypress Ct Unit 3321, Monmouth Junction, NJ 08852 and is currently estimated at $376,071. 3298 Cypress Ct Unit 3321 is a home located in Middlesex County with nearby schools including Brooks Crossing Elementary School, Crossroads North Middle School, and South Brunswick High School.
Ownership History
Date
Name
Owned For
Owner Type
Purchase Details
Closed on
Mar 31, 2008
Sold by
Nowicki Joel T and Medina Volmarid
Bought by
Arcenal Jennifer
Current Estimated Value
Home Financials for this Owner
Home Financials are based on the most recent Mortgage that was taken out on this home.
Original Mortgage
$193,500
Outstanding Balance
$119,538
Interest Rate
5.5%
Mortgage Type
Purchase Money Mortgage
Estimated Equity
$256,533
Purchase Details
Closed on
Sep 24, 1997
Sold by
Caplan Michele
Bought by
Nowicki Joel
Home Financials for this Owner
Home Financials are based on the most recent Mortgage that was taken out on this home.
Original Mortgage
$66,000
Interest Rate
7.41%
Purchase Details
Closed on
Aug 3, 1995
Sold by
Sweeping Morrisville
Bought by
Caplan Brian
Home Financials for this Owner
Home Financials are based on the most recent Mortgage that was taken out on this home.
Original Mortgage
$76,000
Interest Rate
7.48%
Create a Home Valuation Report for This Property
The Home Valuation Report is an in-depth analysis detailing your home's value as well as a comparison with similar homes in the area
Home Values in the Area
Average Home Value in this Area
Purchase History
| Date | Buyer | Sale Price | Title Company |
|---|---|---|---|
| Arcenal Jennifer | $226,000 | -- | |
| Nowicki Joel | $80,000 | -- | |
| Caplan Brian | $79,500 | -- |
Source: Public Records
Mortgage History
| Date | Status | Borrower | Loan Amount |
|---|---|---|---|
| Open | Arcenal Jennifer | $193,500 | |
| Previous Owner | Nowicki Joel | $66,000 | |
| Previous Owner | Caplan Brian | $76,000 |
Source: Public Records
Tax History Compared to Growth
Tax History
| Year | Tax Paid | Tax Assessment Tax Assessment Total Assessment is a certain percentage of the fair market value that is determined by local assessors to be the total taxable value of land and additions on the property. | Land | Improvement |
|---|---|---|---|---|
| 2025 | $4,624 | $85,600 | $45,000 | $40,600 |
| 2024 | $4,458 | $85,600 | $45,000 | $40,600 |
| 2023 | $4,458 | $85,600 | $45,000 | $40,600 |
| 2022 | $4,325 | $85,600 | $45,000 | $40,600 |
| 2021 | $3,329 | $85,600 | $45,000 | $40,600 |
| 2020 | $4,352 | $85,600 | $45,000 | $40,600 |
| 2019 | $4,391 | $85,600 | $45,000 | $40,600 |
| 2018 | $4,247 | $85,600 | $45,000 | $40,600 |
| 2017 | $4,241 | $85,600 | $45,000 | $40,600 |
| 2016 | $4,197 | $85,600 | $45,000 | $40,600 |
| 2015 | $4,069 | $85,600 | $45,000 | $40,600 |
| 2014 | $4,003 | $85,600 | $45,000 | $40,600 |
Source: Public Records
Map
Nearby Homes
- 3242 Cypress Ct Unit 3242
- 3011 Cypress Ct
- 206 Ash Ct
- 4031 Bayberry Ct
- 2002 Sandlewood Ct
- 1111 Hickory Ct
- 1312 Juniper Ct
- 1106 Hickory Ct
- 7041 Elm Ct
- 5192 Beech Ct
- 6143 Cedar Ct
- 209 Gambocz Ct
- 61 Stouts Ln
- 4 Donner Ct
- 6 Donner Ct
- 32 Magnolia Ct
- 30 Magnolia Ct
- 22 Witch Hazel Ct Unit 2
- 586 Ridge Rd
- 9 Kearns Place Unit 3805
- 3282 Cypress Ct
- 3283 Cypress Ct
- 3294 Cypress Ct
- 3291 Cypress Ct
- 3261 Cypress Ct
- 3231 Cypress Ct Unit 3231
- 3252 Cypress Ct
- 3296 Cypress Ct
- 3251 Cypress Ct
- 3295 Cypress Ct
- 3295 Cypress Ct Unit 3302
- 3297 Cypress Ct
- 3253 Cypress Ct
- 3263 Cypress Ct
- 3272 Cypress Ct
- 3293 Cypress Ct
- 3271 Cypress Ct Unit 3271
- 3262 Cypress Ct Unit 3262
- 3292 Cypress Ct
- 3192 Cypress Ct Unit 3192