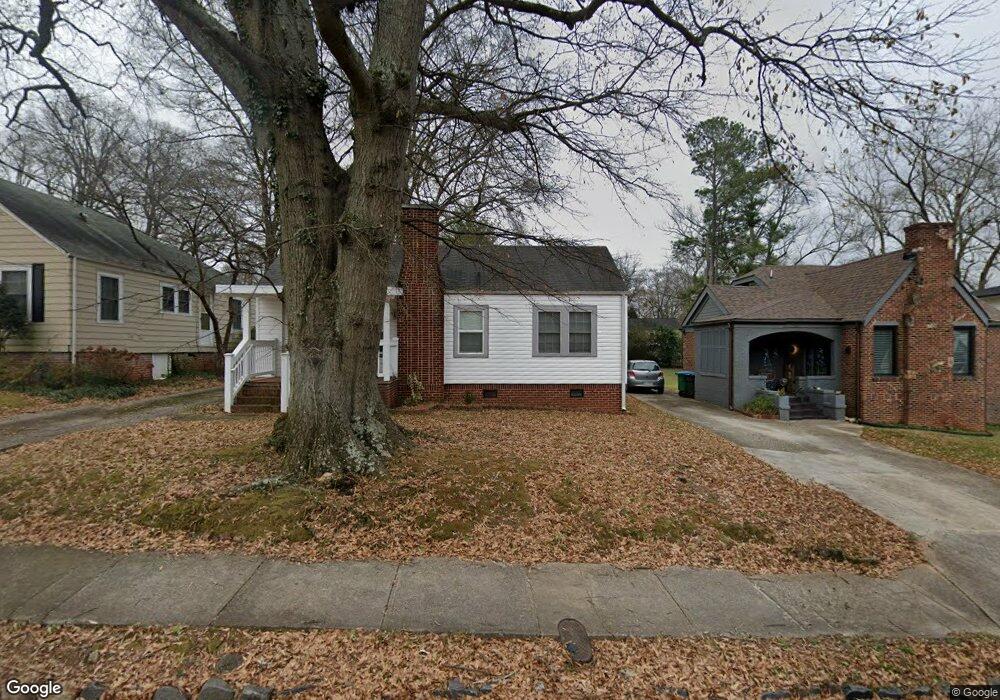
3298 Myrtle St Atlanta, GA 30354
Estimated Value: $202,112 - $279,000
2
Beds
1
Bath
967
Sq Ft
$261/Sq Ft
Est. Value
About This Home
This home is located at 3298 Myrtle St, Atlanta, GA 30354 and is currently estimated at $252,278, approximately $260 per square foot. 3298 Myrtle St is a home located in Fulton County with nearby schools including Hapeville Elementary School, Paul D. West Middle School, and Tri-Cities High School.
Ownership History
Date
Name
Owned For
Owner Type
Purchase Details
Closed on
Jan 28, 2021
Sold by
Sansbury David K
Bought by
Holmes Dianne W and Holmes Dana M
Current Estimated Value
Home Financials for this Owner
Home Financials are based on the most recent Mortgage that was taken out on this home.
Original Mortgage
$157,102
Outstanding Balance
$140,267
Interest Rate
2.6%
Mortgage Type
FHA
Estimated Equity
$112,011
Purchase Details
Closed on
Feb 8, 2008
Sold by
Diorio Edmond D and Diorio Sonia
Bought by
Sansbury David K
Home Financials for this Owner
Home Financials are based on the most recent Mortgage that was taken out on this home.
Original Mortgage
$120,365
Interest Rate
5.85%
Mortgage Type
New Conventional
Purchase Details
Closed on
Sep 8, 1994
Sold by
Howard Gloria N
Bought by
Diorio Edmond D Sonia
Home Financials for this Owner
Home Financials are based on the most recent Mortgage that was taken out on this home.
Original Mortgage
$51,300
Interest Rate
8.51%
Create a Home Valuation Report for This Property
The Home Valuation Report is an in-depth analysis detailing your home's value as well as a comparison with similar homes in the area
Home Values in the Area
Average Home Value in this Area
Purchase History
| Date | Buyer | Sale Price | Title Company |
|---|---|---|---|
| Holmes Dianne W | -- | -- | |
| Sansbury David K | $126,700 | -- | |
| Diorio Edmond D Sonia | $54,000 | -- |
Source: Public Records
Mortgage History
| Date | Status | Borrower | Loan Amount |
|---|---|---|---|
| Open | Holmes Dianne W | $157,102 | |
| Previous Owner | Sansbury David K | $120,365 | |
| Previous Owner | Diorio Edmond D Sonia | $51,300 |
Source: Public Records
Tax History Compared to Growth
Tax History
| Year | Tax Paid | Tax Assessment Tax Assessment Total Assessment is a certain percentage of the fair market value that is determined by local assessors to be the total taxable value of land and additions on the property. | Land | Improvement |
|---|---|---|---|---|
| 2025 | $1,544 | $86,240 | $16,800 | $69,440 |
| 2023 | $2,245 | $79,520 | $15,160 | $64,360 |
| 2022 | $1,684 | $64,000 | $12,200 | $51,800 |
| 2021 | $1,441 | $68,320 | $14,400 | $53,920 |
| 2020 | $1,465 | $64,080 | $14,200 | $49,880 |
| 2019 | $767 | $57,640 | $10,840 | $46,800 |
| 2018 | $527 | $30,760 | $5,120 | $25,640 |
| 2017 | $329 | $19,480 | $3,360 | $16,120 |
| 2016 | $328 | $19,480 | $3,360 | $16,120 |
| 2015 | $487 | $19,480 | $3,360 | $16,120 |
| 2014 | $330 | $19,480 | $3,360 | $16,120 |
Source: Public Records
Map
Nearby Homes
- 754 North Ave
- 647 Coleman St
- 3300 Dogwood Dr Unit 311
- 3301 Sims St
- 3307 Stillwood Dr
- 3216 Dogwood Dr
- 3315 Stillwood Ln
- 3317 Stillwood Ln
- 3312 Springhaven Ave
- 3319 Stillwood Ln
- 3182 Lake Ave
- 3261 N Fulton Ave
- 3249 N Fulton Ave
- 947 Willingham Dr Unit 2
- 3404 Orchard St
- 723 Campbell Cir
- 523 North Ave
- 535 Walnut St
- 725 Oak Dr Unit 8
- 725 Oak Dr
- 3302 Myrtle St
- 3294 Myrtle St
- 3312 Myrtle St
- 3290 Myrtle St
- 3316 Myrtle St
- 3288 Myrtle St
- 3288 Myrtle St
- 3330 Myrtle St
- 3303 N Whitney Ave
- 3309 N Whitney Ave
- 3299 N Whitney Ave
- 3319 N Whitney Ave
- 3286 Myrtle St
- 3291 Myrtle St
- 3305 Myrtle St
- 3299 Myrtle St
- 3295 Myrtle St
- 3295 N Whitney Ave
- 3317 Myrtle St
- 3289 Myrtle St