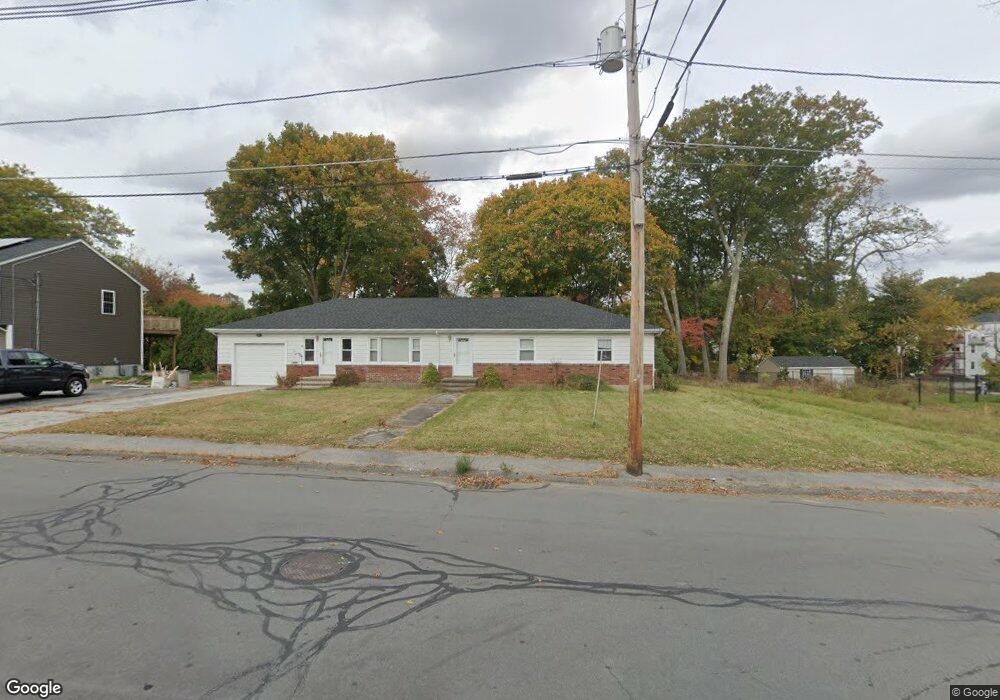
33 1st St Webster, MA 01570
Estimated Value: $418,000 - $478,000
3
Beds
2
Baths
1,768
Sq Ft
$251/Sq Ft
Est. Value
About This Home
This home is located at 33 1st St, Webster, MA 01570 and is currently estimated at $443,639, approximately $250 per square foot. 33 1st St is a home located in Worcester County with nearby schools including Park Avenue Elementary School, Webster Middle School, and Bartlett High School.
Ownership History
Date
Name
Owned For
Owner Type
Purchase Details
Closed on
Nov 13, 2012
Sold by
Day Phyllis L
Bought by
Duffy Carolyn L
Current Estimated Value
Home Financials for this Owner
Home Financials are based on the most recent Mortgage that was taken out on this home.
Original Mortgage
$100,000
Interest Rate
3.42%
Mortgage Type
New Conventional
Purchase Details
Closed on
Jun 21, 2005
Sold by
Klisiewicz Paul A
Bought by
Duffy Carolyn L and Day Phyllis L
Home Financials for this Owner
Home Financials are based on the most recent Mortgage that was taken out on this home.
Original Mortgage
$212,000
Interest Rate
5.78%
Mortgage Type
Purchase Money Mortgage
Purchase Details
Closed on
Mar 25, 2005
Sold by
Klisiewicz John J Est
Bought by
Klisiewicz Paul A
Purchase Details
Closed on
Feb 28, 2005
Sold by
Klisiewicz John J Est
Bought by
Klisiewicz Paul A
Create a Home Valuation Report for This Property
The Home Valuation Report is an in-depth analysis detailing your home's value as well as a comparison with similar homes in the area
Home Values in the Area
Average Home Value in this Area
Purchase History
| Date | Buyer | Sale Price | Title Company |
|---|---|---|---|
| Duffy Carolyn L | -- | -- | |
| Duffy Carolyn L | $265,000 | -- | |
| Klisiewicz Paul A | -- | -- | |
| Klisiewicz Paul A | -- | -- |
Source: Public Records
Mortgage History
| Date | Status | Borrower | Loan Amount |
|---|---|---|---|
| Closed | Duffy Carolyn L | $100,000 | |
| Previous Owner | Duffy Carolyn L | $212,000 |
Source: Public Records
Tax History
| Year | Tax Paid | Tax Assessment Tax Assessment Total Assessment is a certain percentage of the fair market value that is determined by local assessors to be the total taxable value of land and additions on the property. | Land | Improvement |
|---|---|---|---|---|
| 2025 | $4,716 | $397,000 | $66,300 | $330,700 |
| 2024 | $4,652 | $381,900 | $63,800 | $318,100 |
| 2023 | $4,513 | $361,000 | $55,200 | $305,800 |
| 2022 | $4,495 | $322,000 | $53,600 | $268,400 |
| 2021 | $4,320 | $286,100 | $53,600 | $232,500 |
| 2020 | $4,145 | $275,200 | $53,600 | $221,600 |
| 2019 | $3,621 | $236,200 | $53,600 | $182,600 |
| 2018 | $3,384 | $219,900 | $53,600 | $166,300 |
| 2017 | $3,099 | $204,800 | $52,500 | $152,300 |
| 2016 | $2,970 | $196,200 | $52,500 | $143,700 |
| 2015 | $2,826 | $192,500 | $51,500 | $141,000 |
Source: Public Records
Map
Nearby Homes
Your Personal Tour Guide
Ask me questions while you tour the home.