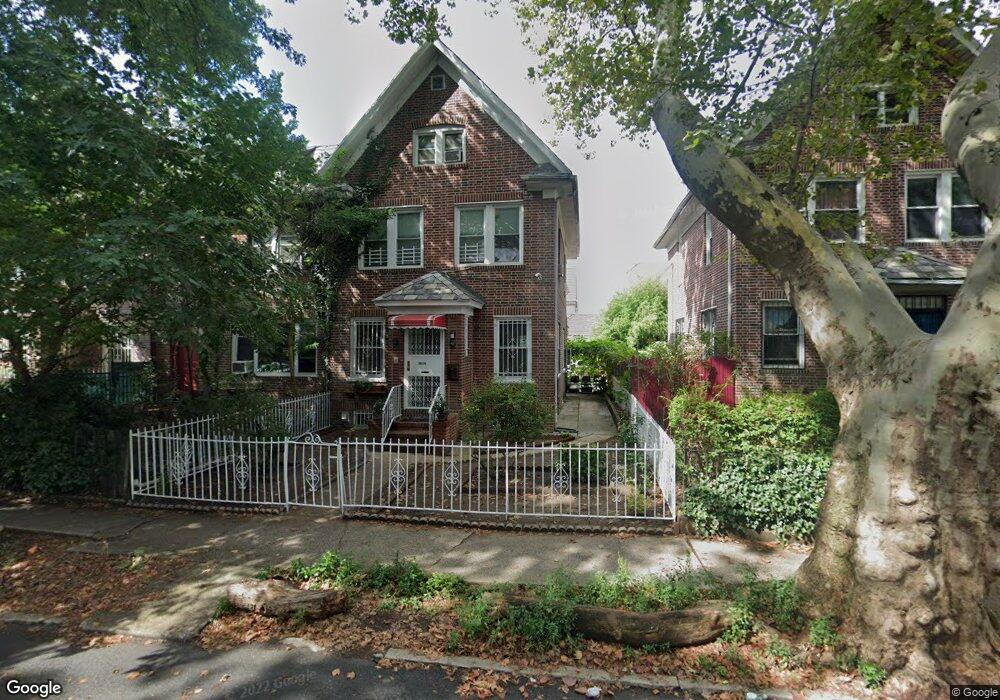
33-26 88th St Jackson Heights, NY 11372
Jackson Heights NeighborhoodEstimated Value: $1,119,000 - $1,360,000
5
Beds
3
Baths
1,650
Sq Ft
$722/Sq Ft
Est. Value
About This Home
This home is located at 33-26 88th St, Jackson Heights, NY 11372 and is currently estimated at $1,190,639, approximately $721 per square foot. 33-26 88th St is a home located in Queens County with nearby schools including P.S. 149 Christa Mcauliffe, I.S. 145 Joseph Pulitzer Magnet School, and Newtown High School.
Ownership History
Date
Name
Owned For
Owner Type
Purchase Details
Closed on
Jan 27, 2020
Sold by
Ali Abdelsattar M
Bought by
Jahan Asmat and Mustafa Golam
Current Estimated Value
Home Financials for this Owner
Home Financials are based on the most recent Mortgage that was taken out on this home.
Original Mortgage
$765,000
Outstanding Balance
$677,725
Interest Rate
3.74%
Mortgage Type
New Conventional
Estimated Equity
$512,914
Purchase Details
Closed on
Feb 19, 2008
Sold by
Choi Jin Kwan and Choi Sang Sun
Bought by
Ali Abdelsattar M
Home Financials for this Owner
Home Financials are based on the most recent Mortgage that was taken out on this home.
Original Mortgage
$380,000
Interest Rate
5.57%
Purchase Details
Closed on
Nov 2, 2001
Sold by
Lam May Fung
Bought by
Choi Sang Sun and Choi Jin Kwan
Home Financials for this Owner
Home Financials are based on the most recent Mortgage that was taken out on this home.
Original Mortgage
$273,750
Interest Rate
6.67%
Mortgage Type
Purchase Money Mortgage
Create a Home Valuation Report for This Property
The Home Valuation Report is an in-depth analysis detailing your home's value as well as a comparison with similar homes in the area
Home Values in the Area
Average Home Value in this Area
Purchase History
| Date | Buyer | Sale Price | Title Company |
|---|---|---|---|
| Jahan Asmat | $980,000 | -- | |
| Ali Abdelsattar M | $675,000 | -- | |
| Ali Abdelsattar M | $675,000 | -- | |
| Choi Sang Sun | -- | -- | |
| Choi Sang Sun | -- | -- |
Source: Public Records
Mortgage History
| Date | Status | Borrower | Loan Amount |
|---|---|---|---|
| Open | Jahan Asmat | $765,000 | |
| Previous Owner | Ali Abdelsattar M | $380,000 | |
| Previous Owner | Choi Sang Sun | $273,750 |
Source: Public Records
Tax History Compared to Growth
Tax History
| Year | Tax Paid | Tax Assessment Tax Assessment Total Assessment is a certain percentage of the fair market value that is determined by local assessors to be the total taxable value of land and additions on the property. | Land | Improvement |
|---|---|---|---|---|
| 2025 | $8,264 | $43,612 | $9,219 | $34,393 |
| 2024 | $8,264 | $41,144 | $10,046 | $31,098 |
| 2023 | $7,796 | $38,816 | $8,087 | $30,729 |
| 2022 | $7,749 | $66,900 | $13,800 | $53,100 |
| 2021 | $7,917 | $70,200 | $13,800 | $56,400 |
| 2020 | $6,150 | $74,340 | $13,800 | $60,540 |
| 2019 | $5,719 | $81,900 | $13,800 | $68,100 |
| 2018 | $6,296 | $32,347 | $7,742 | $24,605 |
| 2017 | $6,294 | $32,347 | $9,162 | $23,185 |
| 2016 | $5,958 | $32,347 | $9,162 | $23,185 |
| 2015 | $3,461 | $30,286 | $11,225 | $19,061 |
| 2014 | $3,461 | $28,573 | $11,367 | $17,206 |
Source: Public Records
Map
Nearby Homes
- 88-09 Northern Blvd Unit 504
- 88-11 Northern Blvd Unit 110
- 87-09 34th Ave Unit 6K
- 87-09 34th Ave Unit 3C
- 86-11 34th Ave Unit 1A
- 32-42 89th St Unit C206
- 32-43 88th St Unit 305
- 3250 87th St
- 88-11 34th Ave Unit 3H
- 32-40 89th St Unit 110
- 87-10 34th Ave Unit 1F
- 87-10 34th Ave Unit 4
- 90-09 Northern Blvd Unit 605
- 90-09 Northern Blvd Unit 303
- 90-09 Northern Blvd Unit 302
- 88-10 34th Ave Unit 1
- 88-10 34th Ave Unit 5L
- 88-10 34th Ave Unit 5C
- 33-05 90th St Unit 4F
- 33-25 90th St Unit 5D