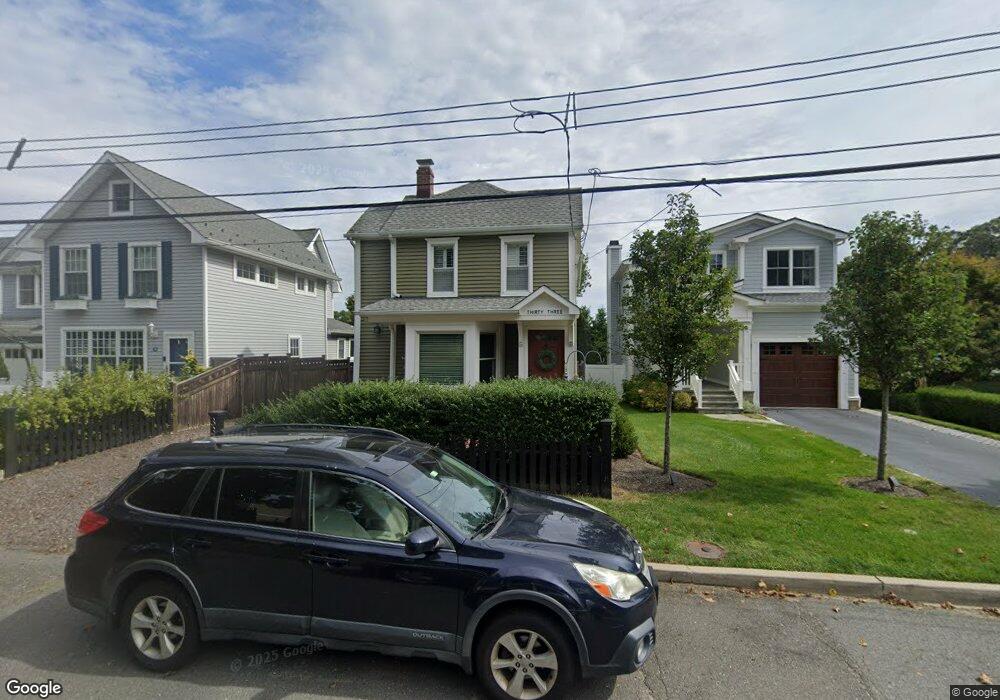
33 3rd St Rumson, NJ 07760
Estimated Value: $1,105,771 - $1,328,000
3
Beds
2
Baths
1,514
Sq Ft
$813/Sq Ft
Est. Value
About This Home
This home is located at 33 3rd St, Rumson, NJ 07760 and is currently estimated at $1,230,693, approximately $812 per square foot. 33 3rd St is a home located in Monmouth County with nearby schools including Deane Porter School, Forrestdale School, and Rumson Fair Haven Regional High School.
Ownership History
Date
Name
Owned For
Owner Type
Purchase Details
Closed on
Sep 14, 1998
Sold by
West Leolin
Bought by
Young Andrwe and Young Breta
Current Estimated Value
Home Financials for this Owner
Home Financials are based on the most recent Mortgage that was taken out on this home.
Original Mortgage
$125,000
Outstanding Balance
$26,702
Interest Rate
6.9%
Estimated Equity
$1,203,991
Create a Home Valuation Report for This Property
The Home Valuation Report is an in-depth analysis detailing your home's value as well as a comparison with similar homes in the area
Home Values in the Area
Average Home Value in this Area
Purchase History
| Date | Buyer | Sale Price | Title Company |
|---|---|---|---|
| Young Andrwe | $165,000 | -- |
Source: Public Records
Mortgage History
| Date | Status | Borrower | Loan Amount |
|---|---|---|---|
| Open | Young Andrwe | $125,000 |
Source: Public Records
Tax History Compared to Growth
Tax History
| Year | Tax Paid | Tax Assessment Tax Assessment Total Assessment is a certain percentage of the fair market value that is determined by local assessors to be the total taxable value of land and additions on the property. | Land | Improvement |
|---|---|---|---|---|
| 2025 | $10,465 | $1,027,100 | $730,900 | $296,200 |
| 2024 | $10,058 | $951,400 | $681,900 | $269,500 |
Source: Public Records
Map
Nearby Homes