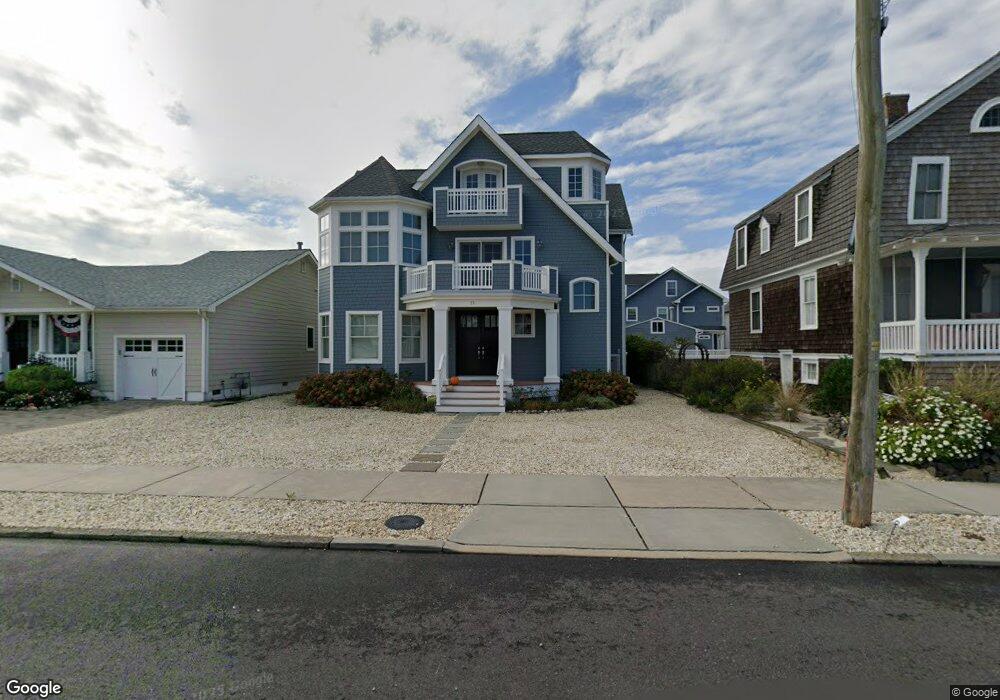
33 5th Ave Seaside Park, NJ 08752
Estimated Value: $1,414,000 - $2,248,000
--
Bed
--
Bath
3,099
Sq Ft
$594/Sq Ft
Est. Value
About This Home
This home is located at 33 5th Ave, Seaside Park, NJ 08752 and is currently estimated at $1,840,675, approximately $593 per square foot. 33 5th Ave is a home located in Ocean County with nearby schools including Central Regional Middle School and Central Regional High School.
Ownership History
Date
Name
Owned For
Owner Type
Purchase Details
Closed on
Apr 9, 2007
Sold by
Smith Lisa K
Bought by
Ahnert Loretta
Current Estimated Value
Purchase Details
Closed on
Mar 20, 2007
Sold by
Ahnert Loretta
Bought by
Doren Joseph and Doren Elizabeth
Purchase Details
Closed on
Feb 9, 1998
Sold by
Gormay Lewis R and Gormay Noel R
Bought by
Gormany Noel R
Create a Home Valuation Report for This Property
The Home Valuation Report is an in-depth analysis detailing your home's value as well as a comparison with similar homes in the area
Home Values in the Area
Average Home Value in this Area
Purchase History
| Date | Buyer | Sale Price | Title Company |
|---|---|---|---|
| Ahnert Loretta | -- | None Available | |
| Doren Joseph | $750,000 | Stewart Title Guaranty Co | |
| Gormany Noel R | -- | -- |
Source: Public Records
Tax History Compared to Growth
Tax History
| Year | Tax Paid | Tax Assessment Tax Assessment Total Assessment is a certain percentage of the fair market value that is determined by local assessors to be the total taxable value of land and additions on the property. | Land | Improvement |
|---|---|---|---|---|
| 2025 | $15,840 | $976,200 | $550,000 | $426,200 |
| 2024 | $15,578 | $968,200 | $550,000 | $418,200 |
| 2023 | $15,026 | $968,200 | $550,000 | $418,200 |
| 2022 | $15,026 | $968,200 | $550,000 | $418,200 |
| 2021 | $14,707 | $968,200 | $550,000 | $418,200 |
| 2020 | $14,552 | $968,200 | $550,000 | $418,200 |
| 2019 | $14,397 | $968,200 | $550,000 | $418,200 |
| 2018 | $13,458 | $968,200 | $550,000 | $418,200 |
| 2017 | $13,661 | $968,200 | $550,000 | $418,200 |
| 2016 | $12,703 | $968,200 | $550,000 | $418,200 |
| 2015 | $13,255 | $968,200 | $550,000 | $418,200 |
| 2014 | $12,664 | $968,200 | $550,000 | $418,200 |
Source: Public Records
Map
Nearby Homes