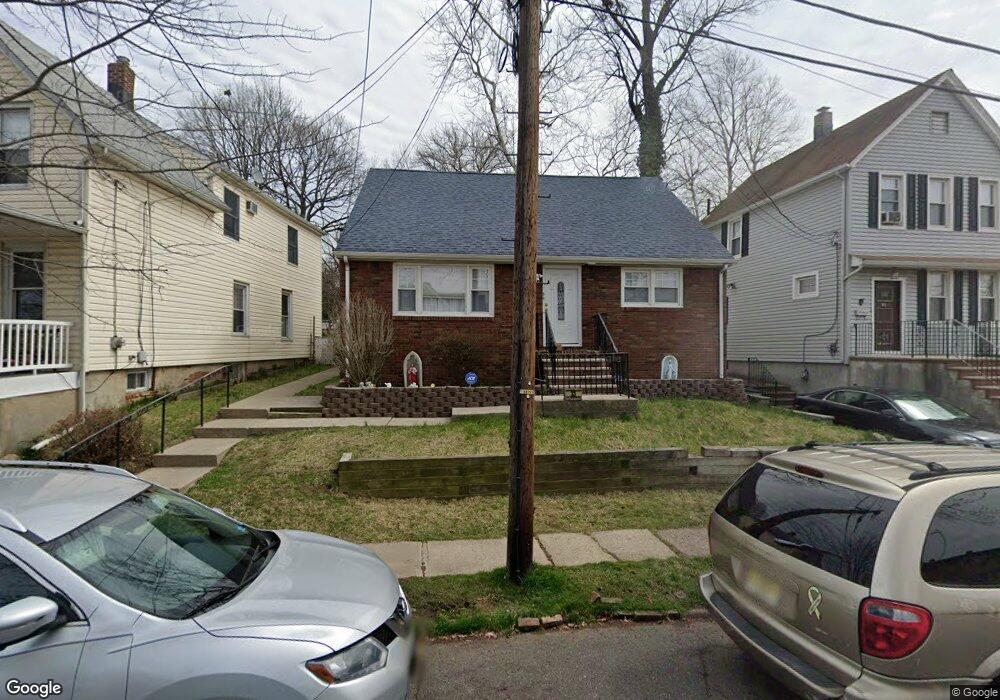
33 5th St Ridgefield Park, NJ 07660
Estimated Value: $594,000 - $820,000
--
Bed
--
Bath
1,740
Sq Ft
$404/Sq Ft
Est. Value
About This Home
This home is located at 33 5th St, Ridgefield Park, NJ 07660 and is currently estimated at $702,777, approximately $403 per square foot. 33 5th St is a home located in Bergen County with nearby schools including Lincoln Elementary School, Ridgefield Park Jr Sr High School, and Academy of Greatness & Excellence.
Ownership History
Date
Name
Owned For
Owner Type
Purchase Details
Closed on
Sep 15, 2015
Sold by
Gneiding Charles
Bought by
Orta Johanna
Current Estimated Value
Home Financials for this Owner
Home Financials are based on the most recent Mortgage that was taken out on this home.
Original Mortgage
$300,162
Outstanding Balance
$232,406
Interest Rate
3.5%
Mortgage Type
FHA
Estimated Equity
$470,371
Purchase Details
Closed on
Aug 27, 2012
Sold by
Wildrick Deborah and Gneiding Janice A
Bought by
Gneiding Gail
Home Financials for this Owner
Home Financials are based on the most recent Mortgage that was taken out on this home.
Original Mortgage
$200,000
Interest Rate
3.57%
Mortgage Type
Unknown
Create a Home Valuation Report for This Property
The Home Valuation Report is an in-depth analysis detailing your home's value as well as a comparison with similar homes in the area
Home Values in the Area
Average Home Value in this Area
Purchase History
| Date | Buyer | Sale Price | Title Company |
|---|---|---|---|
| Orta Johanna | $355,000 | None Available | |
| Gneiding Gail | $287,500 | -- |
Source: Public Records
Mortgage History
| Date | Status | Borrower | Loan Amount |
|---|---|---|---|
| Open | Orta Johanna | $300,162 | |
| Previous Owner | Gneiding Gail | $200,000 |
Source: Public Records
Tax History Compared to Growth
Tax History
| Year | Tax Paid | Tax Assessment Tax Assessment Total Assessment is a certain percentage of the fair market value that is determined by local assessors to be the total taxable value of land and additions on the property. | Land | Improvement |
|---|---|---|---|---|
| 2025 | $14,163 | $488,900 | $228,200 | $260,700 |
| 2024 | $13,820 | $488,900 | $228,200 | $260,700 |
| 2023 | $13,110 | $469,100 | $215,700 | $253,400 |
| 2022 | $13,110 | $418,700 | $183,200 | $235,500 |
| 2021 | $12,071 | $389,300 | $165,700 | $223,600 |
| 2020 | $12,320 | $379,300 | $163,200 | $216,100 |
| 2019 | $12,558 | $318,800 | $132,600 | $186,200 |
| 2018 | $12,267 | $318,800 | $132,600 | $186,200 |
| 2017 | $11,869 | $318,800 | $132,600 | $186,200 |
| 2016 | $11,553 | $318,800 | $132,600 | $186,200 |
| 2015 | $11,317 | $318,800 | $132,600 | $186,200 |
| 2014 | $11,024 | $318,800 | $132,600 | $186,200 |
Source: Public Records
Map
Nearby Homes
- 39 Summit St
- 44 Park St
- 265 Main St Unit 206
- 265 Main St Unit 412
- 114 Hackensack Ave
- 151 4th St
- 19 Highland Place
- 254 Euclid Ave
- 222 4th St
- 168 Hudson Ave
- 19 Roosevelt Ave
- 82 Hazelton St
- 72 Hazelton St
- 40 Arthur St
- 61 Hobart St
- 79 Arthur St
- 195 Park St
- 448 Teaneck Rd
- 20 Hudson Ave
- 468a Liberty St Unit 101