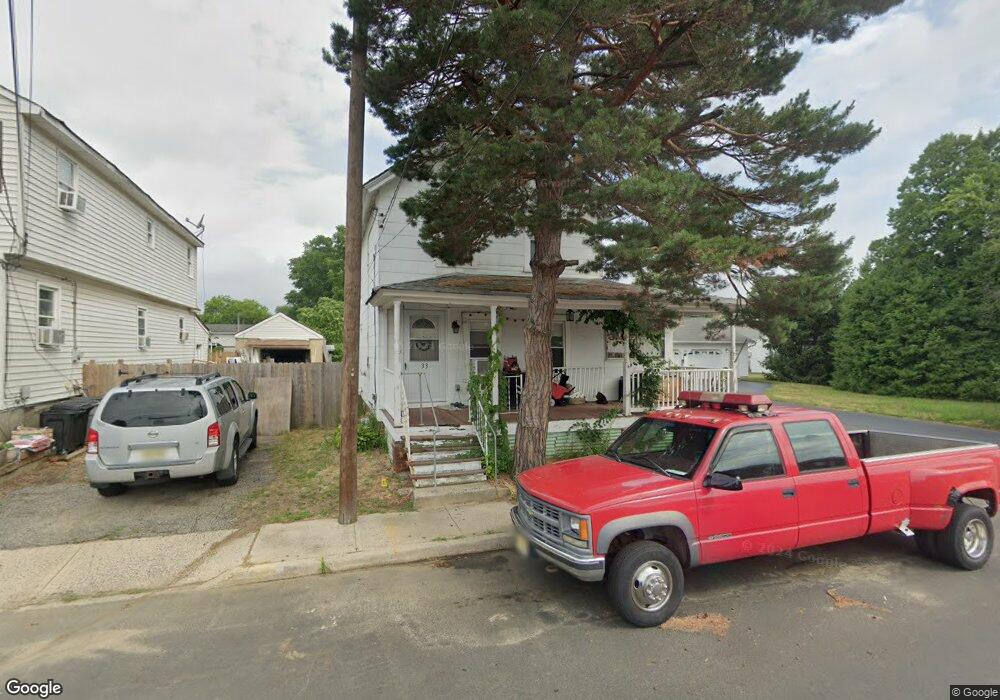
33 8th St Keyport, NJ 07735
Estimated Value: $408,075 - $519,000
2
Beds
1
Bath
1,168
Sq Ft
$399/Sq Ft
Est. Value
About This Home
This home is located at 33 8th St, Keyport, NJ 07735 and is currently estimated at $466,019, approximately $398 per square foot. 33 8th St is a home located in Monmouth County with nearby schools including Keyport Central School, Keyport High School, and Icob Academy.
Ownership History
Date
Name
Owned For
Owner Type
Purchase Details
Closed on
Jul 18, 2023
Sold by
Getter Camille Kovacs
Bought by
Getter Tyler John
Current Estimated Value
Purchase Details
Closed on
Mar 15, 2023
Sold by
Johnson Bernadette Kovacs
Bought by
Olsen Jacqueline Kovacs
Purchase Details
Closed on
May 31, 2014
Sold by
Kovacs John J and Kovacs Annette C
Bought by
Getter Camille Kovacs and Johnson Bernadette Kovacs
Create a Home Valuation Report for This Property
The Home Valuation Report is an in-depth analysis detailing your home's value as well as a comparison with similar homes in the area
Home Values in the Area
Average Home Value in this Area
Purchase History
| Date | Buyer | Sale Price | Title Company |
|---|---|---|---|
| Getter Tyler John | -- | None Listed On Document | |
| Getter Tyler John | -- | None Listed On Document | |
| Olsen Jacqueline Kovacs | -- | None Listed On Document | |
| Olsen Jacqueline Kovacs | -- | None Listed On Document | |
| Getter Camille Kovacs | -- | None Available |
Source: Public Records
Tax History
| Year | Tax Paid | Tax Assessment Tax Assessment Total Assessment is a certain percentage of the fair market value that is determined by local assessors to be the total taxable value of land and additions on the property. | Land | Improvement |
|---|---|---|---|---|
| 2025 | $6,711 | $358,600 | $204,900 | $153,700 |
| 2024 | $6,438 | $324,200 | $178,100 | $146,100 |
Source: Public Records
Map
Nearby Homes
- 74 Manchester Ave
- 72 Manchester Ave
- 6 Octavia Place
- 2108 Florence Ave
- 162 2nd St
- 231 Atlantic St Unit 23
- 231 Atlantic St Unit 83
- 9 Hurley St
- 226 Osborn St
- 104 Church St
- 87 Church St
- 37 Myrtle Ave
- 8 Pine Creek Village
- 40 Church St
- 121-123 Stone Rd
- 55 E Front St
- 75 Broad St
- 308 Stone Rd
- 233 Broadway
- 9 Kearney St Unit A
Your Personal Tour Guide
Ask me questions while you tour the home.