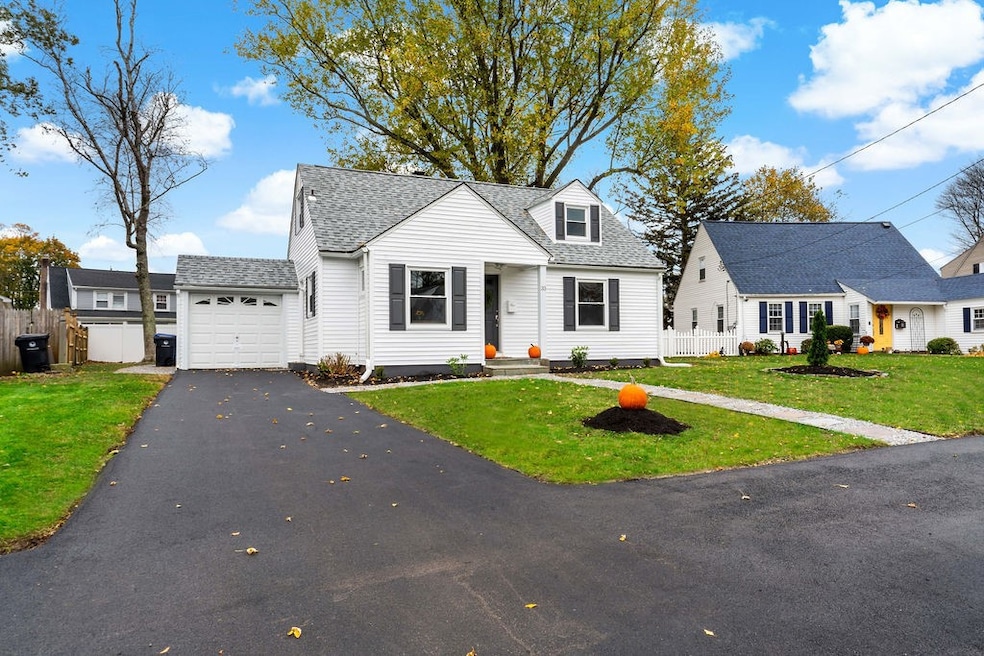
33 Arland Dr Pawtucket, RI 02861
Darlington NeighborhoodEstimated payment $2,829/month
Highlights
- Golf Course Community
- Cape Cod Architecture
- Game Room
- Media Room
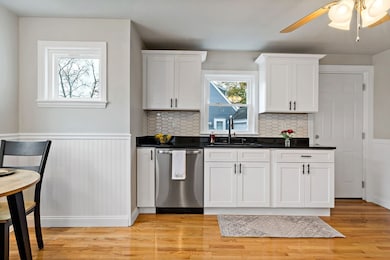
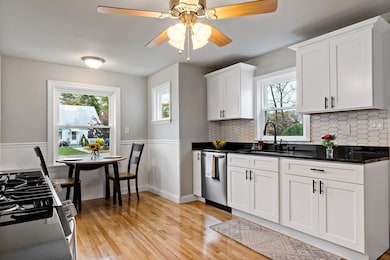
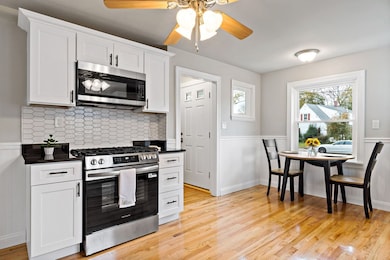
- Wood Flooring
- Home Gym
About This Home
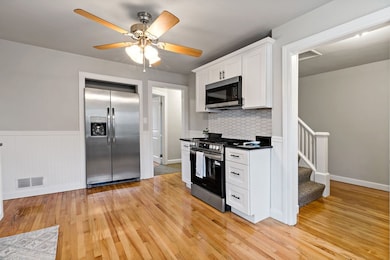
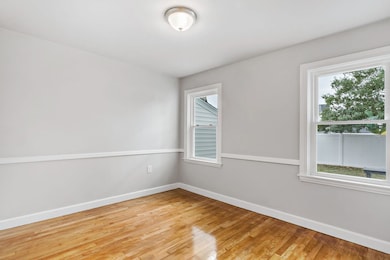
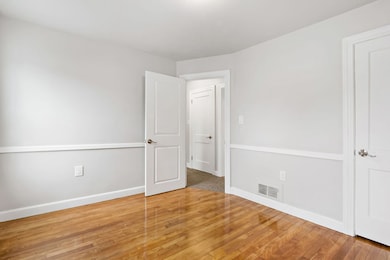
Welcome home to 33 Arland Drive! This renovated 3 4 bedroom/ 2 bath property is perfect for anyone looking for a move-in-ready home with nothing left to do but unpack and enjoy. Step inside to a bright, versatile layout featuring a brand-new kitchen with stone counters, stainless steel appliances, and plenty of cabinet space. Gleaming hardwood flooring, new carpeting, updated bathrooms, and stylish details throughout give this home a fresh, modern feel. The partially finished basement offers extra space perfect for an office, playroom, or workout area. New roof, gutters, driveway, walkways and vinyl replacement windows. 1-car garage and a fenced yard great for relaxing, entertaining, or pets and a convenient location close to schools, shopping, and highway access. Don't miss this opportunity to own a beautifully updated home in a great Pawtucket neighborhood!
Home Details
Home Type
- Single Family
Est. Annual Taxes
- $3,966
Year Built
- Built in 1945
Lot Details
- 5,350 Sq Ft Lot
- Property is zoned RS
Parking
- 1 Car Attached Garage
Home Design
- Cape Cod Architecture
- Combination Foundation
- Vinyl Siding
Interior Spaces
- 3-Story Property
- Fireplace Features Masonry
- Media Room
- Game Room
- Storage Room
- Laundry Room
- Utility Room
- Home Gym
Kitchen
- Oven
- Range
- Microwave
- Dishwasher
Flooring
- Wood
- Carpet
- Ceramic Tile
Bedrooms and Bathrooms
- 3 Bedrooms
- 2 Full Bathrooms
- Bathtub with Shower
Partially Finished Basement
- Basement Fills Entire Space Under The House
- Interior Basement Entry
Utilities
- No Cooling
- Forced Air Heating System
- Heating System Uses Gas
- 100 Amp Service
- Water Heater
Listing and Financial Details
- Tax Lot 73
- Assessor Parcel Number 33ARLANDDRPAWT
Community Details
Overview
- Pine Crest Neighborhood Subdivision
Amenities
- Shops
- Restaurant
- Public Transportation
Recreation
- Golf Course Community
Map
Home Values in the Area
Average Home Value in this Area
Tax History
| Year | Tax Paid | Tax Assessment Tax Assessment Total Assessment is a certain percentage of the fair market value that is determined by local assessors to be the total taxable value of land and additions on the property. | Land | Improvement |
|---|---|---|---|---|
| 2025 | $4,226 | $321,400 | $149,300 | $172,100 |
| 2024 | $3,966 | $321,400 | $149,300 | $172,100 |
| 2023 | $4,069 | $240,200 | $81,400 | $158,800 |
| 2022 | $3,983 | $240,200 | $81,400 | $158,800 |
| 2021 | $3,983 | $240,200 | $81,400 | $158,800 |
| 2020 | $4,514 | $216,100 | $84,800 | $131,300 |
| 2019 | $4,514 | $216,100 | $84,800 | $131,300 |
| 2018 | $4,350 | $216,100 | $84,800 | $131,300 |
| 2017 | $4,546 | $200,100 | $85,600 | $114,500 |
| 2016 | $4,380 | $200,100 | $85,600 | $114,500 |
| 2015 | $4,380 | $200,100 | $85,600 | $114,500 |
| 2014 | $4,206 | $182,400 | $73,800 | $108,600 |
Property History
| Date | Event | Price | List to Sale | Price per Sq Ft |
|---|---|---|---|---|
| 11/04/2025 11/04/25 | For Sale | $475,000 | -- | $234 / Sq Ft |
Purchase History
| Date | Type | Sale Price | Title Company |
|---|---|---|---|
| Warranty Deed | $280,000 | -- | |
| Warranty Deed | $280,000 | -- | |
| Deed | $199,000 | -- | |
| Deed | $199,000 | -- |
Mortgage History
| Date | Status | Loan Amount | Loan Type |
|---|---|---|---|
| Previous Owner | $195,395 | Purchase Money Mortgage |
Source: State-Wide MLS
MLS Number: 1398962
APN: PAWT-000001-000000-000073
Disclaimer: Certain information contained herein is derived from information provided by parties other than Homes.com. All information provided is deemed reliable, but is not guaranteed to be accurate and should be independently verified.
![]() IDX information is provided exclusively for personal, non-commercial use, and may not be used for any purpose other than to identify prospective properties consumers may be interested in purchasing. Information is deemed reliable but not guaranteed.
IDX information is provided exclusively for personal, non-commercial use, and may not be used for any purpose other than to identify prospective properties consumers may be interested in purchasing. Information is deemed reliable but not guaranteed.
Copyright © 2025 State-Wide MLS, Inc. All rights reserved.
- 133 Woodbury St
- 226 Suffolk Ave Unit 226
- 213 Suffolk Ave Unit 213 Suffolk Ave. Pawt
- 25 Hanover Ave Unit 1st FL Front
- 58 Slade St
- 27 Marlaine Dr
- 1 Drolet Ave
- 71 Norton St Unit 3
- 16 Saratoga Ave
- 1172 Roosevelt Ave Unit Third
- 413 Central Ave Unit 3-005
- 413 Central Ave Unit 7-233
- 158 Slater Park Ave Unit 1
- 413 Central Ave
- 61 John St
- 61 John St
- 435 Walcott St Unit 3rd floor
- 881 Washington St Unit B
- 735 Broadway Unit 1
- 735 Broadway Unit 3F
