Estimated Value: $112,241 - $162,000
1
Bed
1
Bath
636
Sq Ft
$223/Sq Ft
Est. Value
About This Home
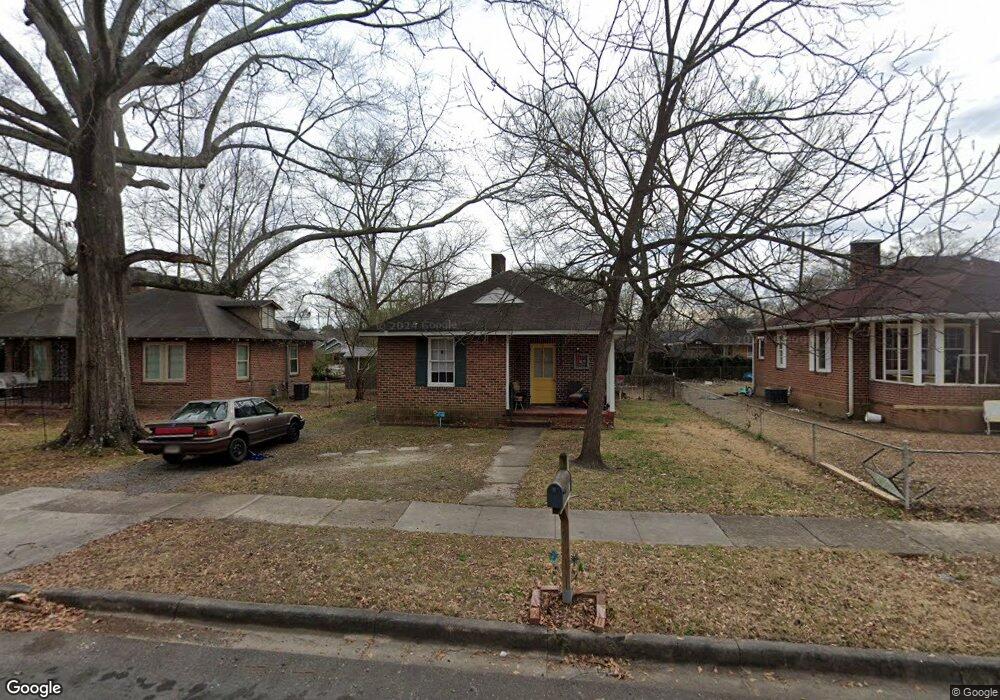
This home is located at 33 Ash St NE, Rome, GA 30161 and is currently estimated at $141,560, approximately $222 per square foot. 33 Ash St NE is a home located in Floyd County with nearby schools including Model Middle School, Model High School, and Unity Christian School.
Ownership History
Date
Name
Owned For
Owner Type
Purchase Details
Closed on
Apr 1, 2002
Sold by
Jones Craig A
Bought by
Morris Mark and Joan Morris
Current Estimated Value
Purchase Details
Closed on
Mar 21, 1997
Sold by
Hubbard Garland W
Bought by
Jones Craig A
Purchase Details
Closed on
Feb 29, 1996
Sold by
Mangum Ralph
Bought by
Hubbard Garland W
Purchase Details
Closed on
Jun 22, 1977
Bought by
P and R
Purchase Details
Closed on
Jun 21, 1977
Sold by
Mangum Maurine
Bought by
Mangum Ralph
Purchase Details
Closed on
Jan 1, 1901
Bought by
Mangum Maurine
Create a Home Valuation Report for This Property
The Home Valuation Report is an in-depth analysis detailing your home's value as well as a comparison with similar homes in the area
Home Values in the Area
Average Home Value in this Area
Purchase History
| Date | Buyer | Sale Price | Title Company |
|---|---|---|---|
| Morris Mark | $38,500 | -- | |
| Jones Craig A | $24,500 | -- | |
| Hubbard Garland W | $20,000 | -- | |
| P | -- | -- | |
| Mangum Ralph | -- | -- | |
| Mangum Maurine | -- | -- |
Source: Public Records
Tax History Compared to Growth
Tax History
| Year | Tax Paid | Tax Assessment Tax Assessment Total Assessment is a certain percentage of the fair market value that is determined by local assessors to be the total taxable value of land and additions on the property. | Land | Improvement |
|---|---|---|---|---|
| 2024 | $1,064 | $32,962 | $9,314 | $23,648 |
| 2023 | $975 | $29,544 | $8,364 | $21,180 |
| 2022 | $694 | $22,287 | $6,843 | $15,444 |
| 2021 | $650 | $20,478 | $6,843 | $13,635 |
| 2020 | $577 | $17,971 | $5,227 | $12,744 |
| 2019 | $528 | $16,641 | $5,227 | $11,414 |
| 2018 | $501 | $15,757 | $5,227 | $10,530 |
| 2017 | $486 | $15,237 | $5,227 | $10,010 |
| 2016 | $507 | $15,720 | $5,920 | $9,800 |
| 2015 | $462 | $13,600 | $2,440 | $11,160 |
| 2014 | $462 | $14,550 | $2,440 | $12,110 |
Source: Public Records
Map
Nearby Homes
- 23 Oak St NE
- 42 Dogwood St NE
- 40 Dogwood St NE
- 27 Oak St NE
- 1 Fir St NE
- 7 Ash St NE
- 0 Cypress St NE Unit 7494593
- 0 Cypress St NE Unit 10422946
- 0 Euclid Ave Unit 10617853
- 205 Couper St NE
- 311 Reynolds St NE
- 411 Woodward St NE
- 541 Reece St NE
- 219 North Ave NE
- 4 N Haven Dr
- 302 Tolbert St
- 2 Lindberg Dr NE
- 17 Joplin St NE
- 7 Roseway Cir NE
- 31 Ash St NE
- 35 Ash St NE
- 29 Ash St NE
- 18 Green St NE
- 20 Green St NE
- 16 Green St NE
- 2 Oak St NE
- 20 Green St NE
- 27 Ash St NE
- 14 Green St NE
- 37 Ash St NE
- 17 Dogwood St NE
- 4 Oak St NE
- 0 Green St NE Unit 7370509
- 0 Green St NE Unit 8396230
- 12 Green St NE
- 19 Dogwood St NE
- 32 Dogwood St NE
- 0 Dogwood St NE Unit 8520143
- 0 Dogwood St NE Unit 8316339