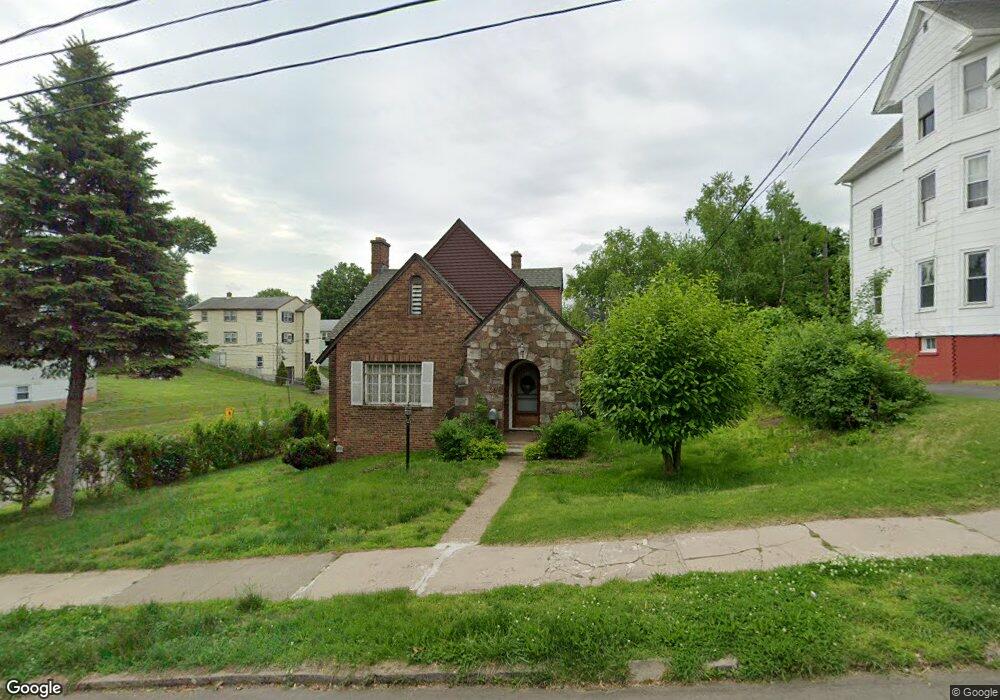
33 Ash St New Britain, CT 06051
Estimated Value: $264,000 - $328,000
3
Beds
3
Baths
1,899
Sq Ft
$159/Sq Ft
Est. Value
About This Home
This home is located at 33 Ash St, New Britain, CT 06051 and is currently estimated at $302,118, approximately $159 per square foot. 33 Ash St is a home located in Hartford County with nearby schools including Northend School, Slade Middle School, and Raymond Hill School.
Ownership History
Date
Name
Owned For
Owner Type
Purchase Details
Closed on
Aug 23, 1996
Sold by
Citicorp Mtg Inc
Bought by
Citicorp North America
Current Estimated Value
Purchase Details
Closed on
Jul 31, 1989
Sold by
Pare Genevieve B
Bought by
Medina Neftali
Home Financials for this Owner
Home Financials are based on the most recent Mortgage that was taken out on this home.
Original Mortgage
$25,783
Interest Rate
9.9%
Create a Home Valuation Report for This Property
The Home Valuation Report is an in-depth analysis detailing your home's value as well as a comparison with similar homes in the area
Home Values in the Area
Average Home Value in this Area
Purchase History
| Date | Buyer | Sale Price | Title Company |
|---|---|---|---|
| Citicorp North America | $74,360 | -- | |
| Medina Neftali | $169,900 | -- |
Source: Public Records
Mortgage History
| Date | Status | Borrower | Loan Amount |
|---|---|---|---|
| Previous Owner | Medina Neftali | $25,783 | |
| Previous Owner | Medina Neftali | $139,500 | |
| Previous Owner | Medina Neftali | $50,000 |
Source: Public Records
Tax History Compared to Growth
Tax History
| Year | Tax Paid | Tax Assessment Tax Assessment Total Assessment is a certain percentage of the fair market value that is determined by local assessors to be the total taxable value of land and additions on the property. | Land | Improvement |
|---|---|---|---|---|
| 2025 | $5,888 | $150,290 | $35,560 | $114,730 |
| 2024 | $5,950 | $150,290 | $35,560 | $114,730 |
| 2023 | $5,753 | $150,290 | $35,560 | $114,730 |
| 2022 | $5,284 | $106,750 | $16,380 | $90,370 |
| 2021 | $5,284 | $106,750 | $16,380 | $90,370 |
| 2020 | $5,391 | $106,750 | $16,380 | $90,370 |
| 2019 | $5,391 | $106,750 | $16,380 | $90,370 |
| 2018 | $5,391 | $106,750 | $16,380 | $90,370 |
| 2017 | $5,172 | $102,410 | $15,050 | $87,360 |
| 2016 | $5,172 | $102,410 | $15,050 | $87,360 |
| 2015 | $5,018 | $102,410 | $15,050 | $87,360 |
| 2014 | $5,018 | $102,410 | $15,050 | $87,360 |
Source: Public Records
Map
Nearby Homes
- 383 S Main St
- 270 Maple St
- 27 Brook St
- 21 Trinity St Unit 23
- 44 Brook St
- 27 Konstin Place
- 27 Andrews St
- 239 Glen St Unit 2A
- 46 Konstin Place Unit A
- 243 Pond St
- 70 Monroe St
- 82 Pond St
- 19 Madison St
- 66 Henry St
- 83 Henry St
- 32 W Pearl St
- 30 Norden St
- 93 Winthrop St
- 70 Fairview St
- 100 Shuttle Meadow Ave