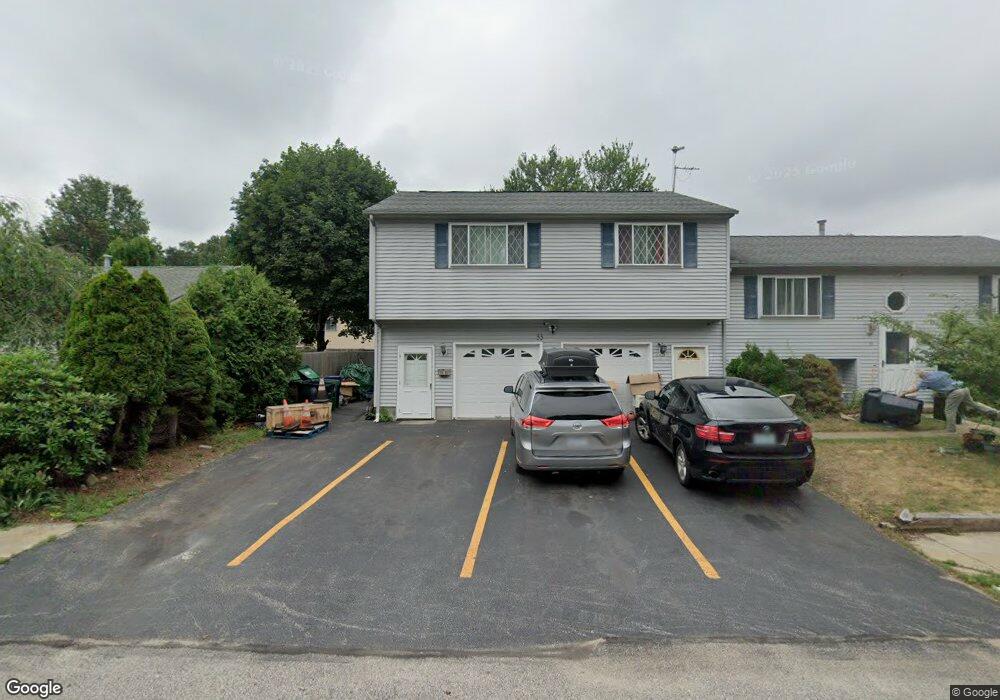
33 Aspen Way Warwick, RI 02886
Greenwood NeighborhoodEstimated Value: $523,000 - $573,000
3
Beds
3
Baths
2,646
Sq Ft
$206/Sq Ft
Est. Value
About This Home
This home is located at 33 Aspen Way, Warwick, RI 02886 and is currently estimated at $545,643, approximately $206 per square foot. 33 Aspen Way is a home located in Kent County with nearby schools including St Rose Of Lima School and Eleanor Briggs School.
Ownership History
Date
Name
Owned For
Owner Type
Purchase Details
Closed on
Jun 30, 2017
Sold by
Cuellar Juan C and Daza Consuelo
Bought by
Gonzalez Jose and Pineda Mireya Y
Current Estimated Value
Home Financials for this Owner
Home Financials are based on the most recent Mortgage that was taken out on this home.
Original Mortgage
$294,566
Outstanding Balance
$242,650
Interest Rate
4.02%
Mortgage Type
FHA
Estimated Equity
$302,993
Purchase Details
Closed on
Oct 2, 2008
Sold by
Detusche Bank Natl T C
Bought by
Cuellar Juan C and Daza Consuelo
Purchase Details
Closed on
Aug 29, 2008
Sold by
Burniston 4Th Harry and Deutsche Bank Natl T C
Bought by
Deutsche Bank Natl T C
Purchase Details
Closed on
Jan 14, 1993
Sold by
Centerville Bldrs Inc
Bought by
Burniston Harry and Burniston Pamela
Create a Home Valuation Report for This Property
The Home Valuation Report is an in-depth analysis detailing your home's value as well as a comparison with similar homes in the area
Home Values in the Area
Average Home Value in this Area
Purchase History
| Date | Buyer | Sale Price | Title Company |
|---|---|---|---|
| Gonzalez Jose | $300,000 | -- | |
| Cuellar Juan C | $220,000 | -- | |
| Deutsche Bank Natl T C | $208,250 | -- | |
| Burniston Harry | $100,000 | -- | |
| Burniston Harry | $100,000 | -- |
Source: Public Records
Mortgage History
| Date | Status | Borrower | Loan Amount |
|---|---|---|---|
| Open | Gonzalez Jose | $294,566 | |
| Previous Owner | Burniston Harry | $167,000 | |
| Previous Owner | Burniston Harry | $230,833 |
Source: Public Records
Tax History
| Year | Tax Paid | Tax Assessment Tax Assessment Total Assessment is a certain percentage of the fair market value that is determined by local assessors to be the total taxable value of land and additions on the property. | Land | Improvement |
|---|---|---|---|---|
| 2025 | $6,427 | $506,100 | $104,900 | $401,200 |
| 2024 | $6,506 | $449,600 | $83,000 | $366,600 |
| 2023 | $6,380 | $449,600 | $83,000 | $366,600 |
| 2022 | $6,256 | $334,000 | $57,400 | $276,600 |
| 2021 | $6,256 | $334,000 | $57,400 | $276,600 |
| 2020 | $6,988 | $373,100 | $57,400 | $315,700 |
| 2019 | $6,988 | $373,100 | $57,400 | $315,700 |
| 2018 | $5,509 | $272,200 | $56,100 | $216,100 |
| 2017 | $5,509 | $272,200 | $56,100 | $216,100 |
| 2016 | $5,509 | $272,200 | $56,100 | $216,100 |
| 2015 | $5,843 | $281,600 | $56,400 | $225,200 |
| 2014 | $5,649 | $281,600 | $56,400 | $225,200 |
| 2013 | $5,573 | $281,600 | $56,400 | $225,200 |
Source: Public Records
Map
Nearby Homes
- 45 Tourtelot Ave
- 3524 W Shore Rd Unit 215
- 5 Barre Ct
- 84 Spruce St
- 2907 Post Rd Unit 4
- 2907 Post Rd Unit 2
- 2907 Post Rd Unit 3
- 157 George Arden Ave
- 20 Darrow Dr
- 3399 Post Rd Unit 15
- 74 Stephens Ave
- 110 Tiernan Ave
- 62 Red Maple Ln
- 86 Red Maple Ln
- 345 Nausauket Rd
- 233 Palace Ave
- 52 Benefit St
- 88 Child Ln
- 132 Bakers Creek Rd
- 38 Red Maple Ln
Your Personal Tour Guide
Ask me questions while you tour the home.