Estimated Value: $200,000 - $205,000
Studio
2
Baths
1,549
Sq Ft
$131/Sq Ft
Est. Value
About This Home
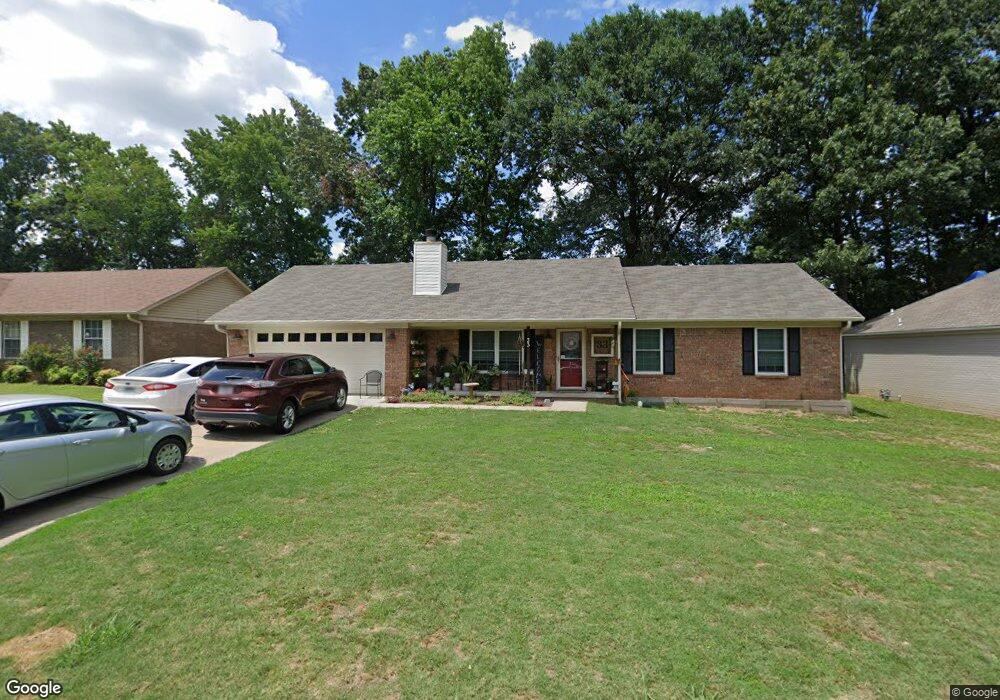
This home is located at 33 Bent Tree Dr, Cabot, AR 72023 and is currently estimated at $202,588, approximately $130 per square foot. 33 Bent Tree Dr is a home located in Lonoke County with nearby schools including Central Elementary School, Cabot Junior High South, and Cabot Middle School South.
Ownership History
Date
Name
Owned For
Owner Type
Purchase Details
Closed on
Aug 4, 2010
Sold by
Grant Kimberly Ann
Bought by
Hollis Billy K and Hollis Glenna M
Current Estimated Value
Home Financials for this Owner
Home Financials are based on the most recent Mortgage that was taken out on this home.
Original Mortgage
$116,961
Outstanding Balance
$78,371
Interest Rate
4.81%
Estimated Equity
$124,217
Purchase Details
Closed on
Jun 18, 2010
Sold by
Grant Kimberly Ann
Bought by
Hollis Billy K and Hollis Glenna M
Home Financials for this Owner
Home Financials are based on the most recent Mortgage that was taken out on this home.
Original Mortgage
$116,961
Outstanding Balance
$78,371
Interest Rate
4.81%
Estimated Equity
$124,217
Purchase Details
Closed on
Jul 26, 1994
Bought by
Gaunt and Wife Kimberly
Purchase Details
Closed on
Nov 30, 1993
Bought by
Underwood Const
Create a Home Valuation Report for This Property
The Home Valuation Report is an in-depth analysis detailing your home's value as well as a comparison with similar homes in the area
Purchase History
| Date | Buyer | Sale Price | Title Company |
|---|---|---|---|
| Hollis Billy K | -- | -- | |
| Hollis Billy K | -- | -- | |
| Gaunt | $65,000 | -- | |
| Gaunt | $65,000 | -- | |
| Underwood Const | $10,000 | -- |
Source: Public Records
Mortgage History
| Date | Status | Borrower | Loan Amount |
|---|---|---|---|
| Open | Hollis Billy K | $116,961 | |
| Previous Owner | Hollis Billy K | $116,961 |
Source: Public Records
Tax History Compared to Growth
Tax History
| Year | Tax Paid | Tax Assessment Tax Assessment Total Assessment is a certain percentage of the fair market value that is determined by local assessors to be the total taxable value of land and additions on the property. | Land | Improvement |
|---|---|---|---|---|
| 2025 | $816 | $24,380 | $2,800 | $21,580 |
| 2024 | $816 | $24,380 | $2,800 | $21,580 |
| 2023 | $816 | $24,380 | $2,800 | $21,580 |
| 2022 | $866 | $24,380 | $2,800 | $21,580 |
| 2021 | $816 | $24,380 | $2,800 | $21,580 |
| 2020 | $760 | $22,290 | $2,800 | $19,490 |
| 2019 | $760 | $22,290 | $2,800 | $19,490 |
| 2018 | $751 | $22,290 | $2,800 | $19,490 |
| 2017 | $1,023 | $22,290 | $2,800 | $19,490 |
| 2016 | $751 | $22,290 | $2,800 | $19,490 |
| 2015 | $988 | $21,530 | $2,800 | $18,730 |
| 2014 | $714 | $21,530 | $2,800 | $18,730 |
Source: Public Records
Map
Nearby Homes
- 34 Bent Tree Dr
- 40 Bent Tree Dr
- 92 Sycamore Cir
- 37 Pond St
- 26 W Plaza Blvd
- 75 Pear St
- 00 Plaza Blvd
- 49 Oak Meadows Dr
- 57 Meadowlark Dr
- 11 Meadowlark Dr
- 14 Meadowlark Dr
- 16 Meadowlark Dr
- 19 Sycamore St
- 30 Meadowlark Dr
- 805 Eastern Ave
- 20 Jay Cir Unit A
- 00 King Dr
- 00 Kerr Station Rd
- 505 S Grant St
- 509 E Myrtle St