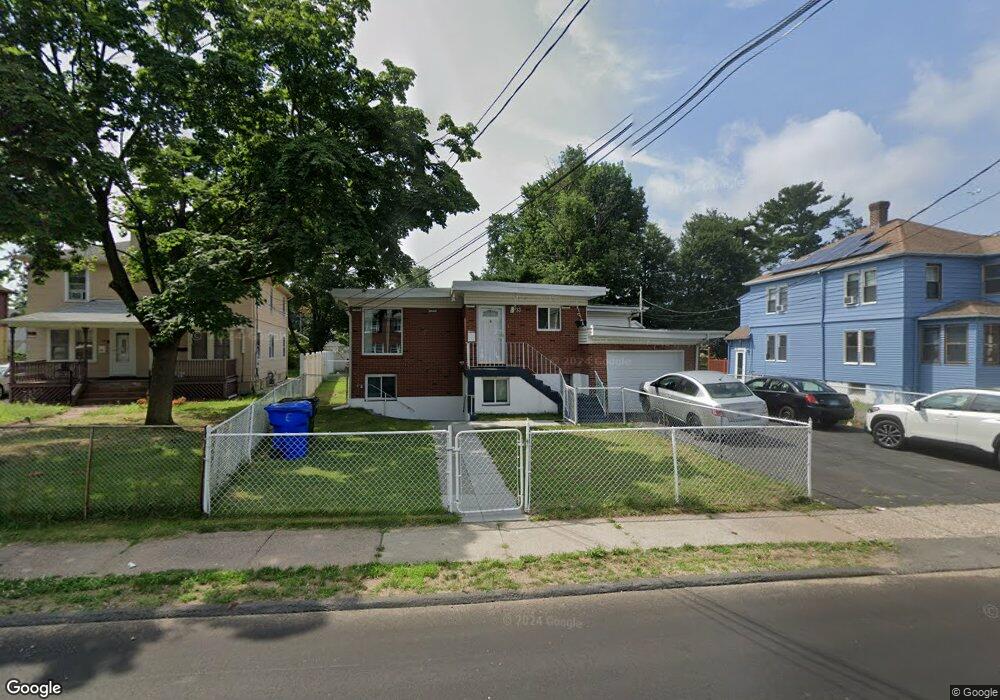
33 Brown St East Hartford, CT 06118
Estimated Value: $293,639 - $317,000
3
Beds
3
Baths
1,399
Sq Ft
$216/Sq Ft
Est. Value
About This Home
This home is located at 33 Brown St, East Hartford, CT 06118 and is currently estimated at $302,160, approximately $215 per square foot. 33 Brown St is a home located in Hartford County with nearby schools including East Hartford Middle School and East Hartford High School.
Ownership History
Date
Name
Owned For
Owner Type
Purchase Details
Closed on
Dec 23, 1994
Sold by
Loewenberg Peter C Est
Bought by
Quispe Marcos A and Quispe Tamy
Current Estimated Value
Home Financials for this Owner
Home Financials are based on the most recent Mortgage that was taken out on this home.
Original Mortgage
$94,000
Interest Rate
9.19%
Mortgage Type
Unknown
Create a Home Valuation Report for This Property
The Home Valuation Report is an in-depth analysis detailing your home's value as well as a comparison with similar homes in the area
Home Values in the Area
Average Home Value in this Area
Purchase History
| Date | Buyer | Sale Price | Title Company |
|---|---|---|---|
| Quispe Marcos A | $47,500 | -- |
Source: Public Records
Mortgage History
| Date | Status | Borrower | Loan Amount |
|---|---|---|---|
| Open | Quispe Marcos A | $148,000 | |
| Closed | Quispe Marcos A | $131,852 | |
| Closed | Quispe Marcos A | $27,410 | |
| Closed | Quispe Marcos A | $94,000 | |
| Closed | Quispe Marcos A | $3,000 |
Source: Public Records
Tax History Compared to Growth
Tax History
| Year | Tax Paid | Tax Assessment Tax Assessment Total Assessment is a certain percentage of the fair market value that is determined by local assessors to be the total taxable value of land and additions on the property. | Land | Improvement |
|---|---|---|---|---|
| 2025 | $6,725 | $146,510 | $35,970 | $110,540 |
| 2024 | $6,446 | $146,510 | $35,970 | $110,540 |
| 2023 | $6,233 | $146,510 | $35,970 | $110,540 |
| 2022 | $6,007 | $146,510 | $35,970 | $110,540 |
| 2021 | $5,390 | $109,220 | $25,650 | $83,570 |
| 2020 | $5,452 | $109,220 | $25,650 | $83,570 |
| 2019 | $5,364 | $109,220 | $25,650 | $83,570 |
| 2018 | $5,205 | $109,220 | $25,650 | $83,570 |
| 2017 | $5,139 | $109,220 | $25,650 | $83,570 |
| 2016 | $4,899 | $106,820 | $22,440 | $84,380 |
| 2015 | $4,899 | $106,820 | $22,440 | $84,380 |
| 2014 | $4,850 | $106,820 | $22,440 | $84,380 |
Source: Public Records
Map
Nearby Homes
- 441 Main St Unit 404
- 24 Whiting Rd
- 67 Sisson St Unit 69
- 49 Willys St
- 16 Whitney St
- 61 Central Ave Unit 63
- 50 Garvan St
- 31 High St Unit 8204
- 41 Bissell St
- 88 Governor St Unit 90
- 115 Governor St
- 47 Elm St
- 347 Prospect St Unit 349
- 60 van Block Ave Unit 10D
- 64 van Block Ave Unit 9B
- 279 Prospect St
- 52 Burnside Ave
- 247 Main St
- 98 Olmsted St
- 85R Olmsted St
- 27 Brown St Unit 29
- 21 Brown St Unit 23
- 21 Brown St (23)
- 15 Brown St
- 41 Brown St
- 15 Brown St Unit 17
- 37 Brown St Unit 39
- 41 Brown St Unit 43
- 30 Judson Ave Unit 32
- 3 Brown St
- 26 Judson Ave
- 26 Judson Ave Unit 2nd floor
- 24 Judson Ave Unit 26
- 24-26 Judson Ave
- 24 Judson Ave Unit 1
- 47 Brown St
- 47 Brown St Unit 49
- 36 Judson Ave
- 46 Judson Ave
- 40 Judson Ave Unit 42