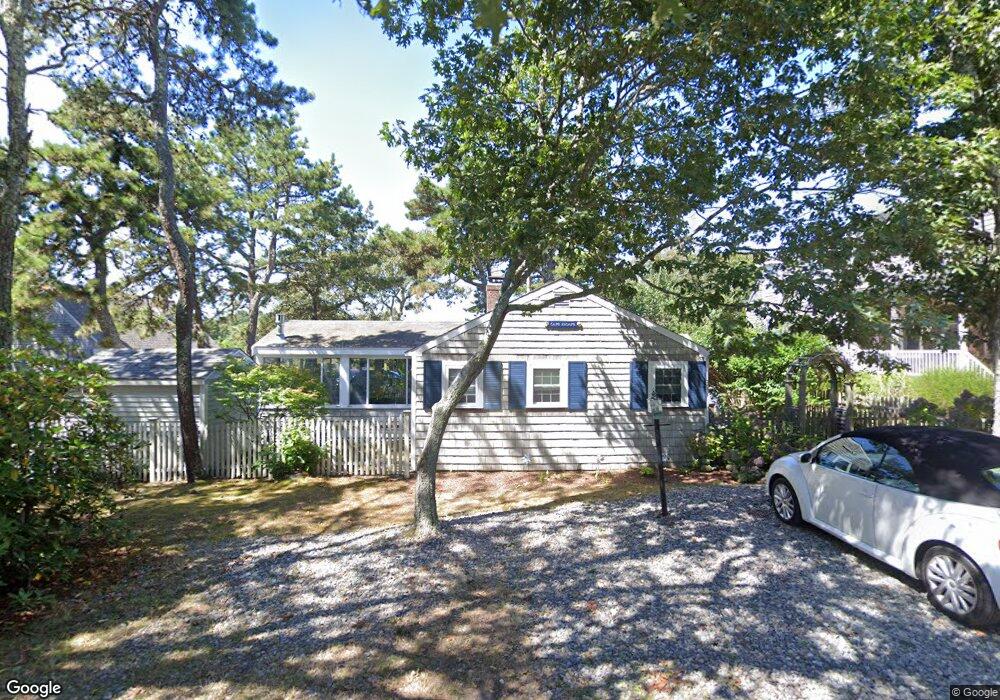
33 Caleb St Dennis Port, MA 2639
Dennis Port NeighborhoodEstimated Value: $608,843 - $711,000
2
Beds
1
Bath
650
Sq Ft
$1,000/Sq Ft
Est. Value
About This Home
This home is located at 33 Caleb St, Dennis Port, MA 2639 and is currently estimated at $649,711, approximately $999 per square foot. 33 Caleb St is a home located in Barnstable County with nearby schools including Dennis-Yarmouth Regional High School and St. Pius X. School.
Ownership History
Date
Name
Owned For
Owner Type
Purchase Details
Closed on
Apr 12, 2016
Sold by
Dixon Sheila A
Bought by
Sheila A Dixon Irt and Baranowski
Current Estimated Value
Purchase Details
Closed on
Feb 27, 2004
Sold by
Carellas George A and Carellas Peter
Bought by
Dixon Christopher B and Dixon Sheila A
Home Financials for this Owner
Home Financials are based on the most recent Mortgage that was taken out on this home.
Original Mortgage
$240,000
Interest Rate
5.65%
Mortgage Type
Purchase Money Mortgage
Create a Home Valuation Report for This Property
The Home Valuation Report is an in-depth analysis detailing your home's value as well as a comparison with similar homes in the area
Home Values in the Area
Average Home Value in this Area
Purchase History
| Date | Buyer | Sale Price | Title Company |
|---|---|---|---|
| Sheila A Dixon Irt | -- | -- | |
| Sheila A Dixon Irt | -- | -- | |
| Christopher B Dixon Ir B | -- | -- | |
| Christopher B Dixon Ir B | -- | -- | |
| Dixon Christopher B | -- | -- | |
| Dixon Christopher B | -- | -- | |
| Dixon Christopher B | $303,000 | -- | |
| Dixon Christopher B | $303,000 | -- |
Source: Public Records
Mortgage History
| Date | Status | Borrower | Loan Amount |
|---|---|---|---|
| Previous Owner | Dixon Christopher B | $240,000 |
Source: Public Records
Tax History Compared to Growth
Tax History
| Year | Tax Paid | Tax Assessment Tax Assessment Total Assessment is a certain percentage of the fair market value that is determined by local assessors to be the total taxable value of land and additions on the property. | Land | Improvement |
|---|---|---|---|---|
| 2025 | $2,388 | $551,400 | $297,200 | $254,200 |
| 2024 | $2,271 | $517,200 | $285,800 | $231,400 |
| 2023 | $2,196 | $470,300 | $259,800 | $210,500 |
| 2022 | $2,242 | $400,300 | $244,900 | $155,400 |
| 2021 | $0 | $369,300 | $240,100 | $129,200 |
| 2020 | $2,342 | $383,900 | $266,800 | $117,100 |
| 2019 | $0 | $381,100 | $261,600 | $119,500 |
| 2018 | $0 | $318,600 | $209,200 | $109,400 |
| 2017 | $1,936 | $314,800 | $209,200 | $105,600 |
| 2016 | $1,922 | $294,400 | $204,200 | $90,200 |
| 2015 | $1,884 | $294,400 | $204,200 | $90,200 |
| 2014 | $1,838 | $289,400 | $199,200 | $90,200 |
Source: Public Records
Map
Nearby Homes
- 1 Belmont Rd Unit 630
- 1 Belmont Rd Unit 513
- 1 E Belmont Unit 630
- 26 Manning Rd
- 11 Ocean Park W
- 3 Fairbanks Dr
- 9 Chase Ave Unit 6
- 159 Center St Unit 22
- 402 Old Wharf Rd
- 402 Old Wharf Rd
- 405 Old Wharf Rd Unit B204
- 405 Old Wharf Rd Unit B204
- 73 Division St
- 12 Cross St
- 19 Riverway
- 148 Belmont Rd
- 19 Riverway
- 102 Sea St
- 24 Chase St
- 24 Chase St