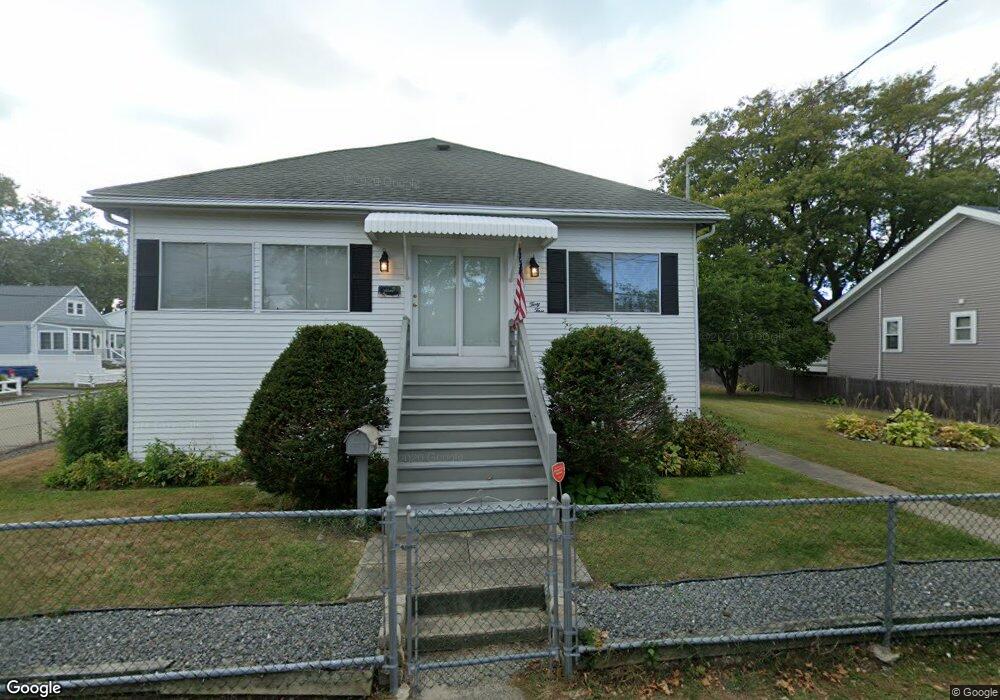
33 Central Ave Unit YR RND Hull, MA 02045
The Alphabets NeighborhoodEstimated Value: $569,000 - $729,000
2
Beds
2
Baths
1,350
Sq Ft
$459/Sq Ft
Est. Value
About This Home
This home is located at 33 Central Ave Unit YR RND, Hull, MA 02045 and is currently estimated at $619,082, approximately $458 per square foot. 33 Central Ave Unit YR RND is a home located in Plymouth County with nearby schools including Lillian M. Jacobs Elementary School, Memorial Middle School, and Hull High School.
Ownership History
Date
Name
Owned For
Owner Type
Purchase Details
Closed on
Aug 18, 2014
Sold by
Collings Linda J
Bought by
Linda J Collings Ret and Collings
Current Estimated Value
Purchase Details
Closed on
May 24, 2013
Sold by
Collings Thomas A
Bought by
Collings Thomas A and Collings Linda J
Create a Home Valuation Report for This Property
The Home Valuation Report is an in-depth analysis detailing your home's value as well as a comparison with similar homes in the area
Home Values in the Area
Average Home Value in this Area
Purchase History
| Date | Buyer | Sale Price | Title Company |
|---|---|---|---|
| Linda J Collings Ret | -- | -- | |
| Collings Thomas A | -- | -- | |
| Collings Thomas A | -- | -- |
Source: Public Records
Tax History Compared to Growth
Tax History
| Year | Tax Paid | Tax Assessment Tax Assessment Total Assessment is a certain percentage of the fair market value that is determined by local assessors to be the total taxable value of land and additions on the property. | Land | Improvement |
|---|---|---|---|---|
| 2025 | $5,393 | $481,500 | $251,900 | $229,600 |
| 2024 | $5,291 | $454,200 | $240,300 | $213,900 |
| 2023 | $5,272 | $433,200 | $232,600 | $200,600 |
| 2022 | $5,104 | $407,000 | $217,100 | $189,900 |
| 2021 | $4,837 | $381,500 | $193,800 | $187,700 |
| 2020 | $4,654 | $363,000 | $201,600 | $161,400 |
| 2019 | $4,400 | $337,200 | $186,000 | $151,200 |
| 2018 | $5,932 | $319,900 | $186,000 | $133,900 |
| 2017 | $4,249 | $309,700 | $186,000 | $123,700 |
| 2016 | $3,966 | $294,200 | $170,500 | $123,700 |
| 2015 | $3,612 | $259,100 | $143,400 | $115,700 |
| 2014 | $3,311 | $238,700 | $131,800 | $106,900 |
Source: Public Records
Map
Nearby Homes